Tuesday, December 20, 2011

20th Dec 2011–Did you see Santa?

Ticker:


  1. SPY and VXX


Topic:


  1. SPY versus VXX, cross-road towards Christmas.


Lesson Learnt:


  1. Both intraday and daily chart of VXX still trend downward even though indexes are trending down these few days.
  2. Weekly VXX chart is still below its 20MA line and also the trend line which is now its resistance line. The odds are it should trend down to get to is supporting line of 50MA line.
  3. Daily SPY chart has reach its 100MA support line and the trend line.
  4. Weekly SPY chart shows that it has reach support lines of 20MA and 100MA.
  5. The odds seems to be at SPY side. However, things can get ugly very quickly. We are now at a very important and interesting cross-road towards Christmas.


Intraday Chart

clip_image001


clip_image002


Historical Chart

clip_image003


clip_image004


clip_image005

Monday, December 12, 2011

12th Dec 2011–My Analysis

BULL or BEAR ??


Short term (1 week)

Notes

clip_image001

-- GLD and SLV charts have started to shows strong possibility of downtrend. What is that going to mean to the market?
-- All 3 indexes are still healthy with NASDAQ lagging behind.

-- All sectors are now hitting at the top limit lines. Retracement is highly expected.

-- Shipping index is still on its uptrend.

-- UNG is going straight to hell.


SPY (30 years monthly) chart:


clip_image002


Input:


  1. Long term SPY chart is pretty bullish. Price remain above the 20MA line and the trend line.


Next Week Economic Data (1 week):


clip_image003


Input:


  1. Heavy data week. Retail Sales, CPI and PPI all in. Volatility will be pretty high at end of week.


VXX chart:


clip_image004


clip_image005


Input:


  1. Daily VXX chart shows a Bearish candle breaking down the 100MA line again. Expect it to retest the support line at around 36.00. Watch out for strong rebound.


SPY chart:


clip_image006


Input:


  1. Daily SPY chart shows that the price has came all the way back up to retest the 200MA line and trend line. A very bullish act. However, please expect a short term retracement before the next leg up.
  2. Daily chart shows that the next support is at 123.00 with 20MA and 50MA lines.


DJIA chart:


clip_image007


clip_image008


Input:


  1. Daily DJIA chart shows that it has strong support from its 200MA line.
  2. Weekly chart shows that support is at 50MA line.


NASDAQ chart:


clip_image009


clip_image010


Input:


  1. NASDAQ is the only index that is lagging behind of all 3 indexes.
  2. Daily NASDAQ chart shows that it is facing resistance from 200MA line.
  3. Weekly chart facing resistance from 50MA line.


UUP chart:


clip_image011


clip_image012


Input:


  1. UUP uptrend is still intact, this is not a very good news for equity.


Sector Analysis:


clip_image013


Input:


  1. As the charts showed, many sectors have hit the top limit. Correction is highly expected.


Copper JJC  chart:


clip_image014


Input:


  1. JJC is dropping back to its 20MA and 50MA support lines.


GLD and SLV charts:


clip_image015


clip_image016


Input:


  1. GLD and SLV downtrend looks like just got started.


 Petrol and Natural Gas charts:


clip_image017


clip_image018


Input:


  1. USO is resting on its 200MA support line.
  2. Way to go…. UNG!!!


FXI (iShares FTSE / Xinhua China 25 Index Fund) chart:


clip_image019


Input:


  1. FXI daily chart still face resistance from its trend line and 20MA and 100MA lines.


Baltic Dry Index chart:


clip_image020


Input:


  1. Baltic shipping index is pretty encouraging.

Friday, December 9, 2011

9th Dec 2011–DEX’s the One

Buy $

Sell $

Sell Short $

Buy Back $

Stop Loss $

Profit / Losses

Duration

0.78


0.85


index 

Reason for Buy / Sell / Sell Short / Buy Back:


  1. Quarterly announcement was good and market likes it, its price went from $0.80 to $1.40, a very encouraging sign.
  2. Waited patiently for it to cool down and it came all the way down to its daily 50MA line and almost reach the previous launching price. Price start to stable at intraday chart. Set and got it at $0.78.


Lesson Learnt:


  1. Bought this stock before at $3.xx something, but did the right decision to cut loss at that time. Stop loss save me and now patient reward me back for monitoring it continuously.
  2. Excellent strong volume came in after purchase when it shot up again, another very encouraging sign.
  3. Daily chart shows that it has support from 50MA and 100MA lines.
  4. Weekly chart shows that it has overcame its 20MA line and now resting on it.
  5. Plan for a top up when it came down to $1.10.


Intraday Chart

clip_image001


clip_image002


Historical Chart

clip_image003


clip_image004

Wednesday, December 7, 2011

7th Dec 2011–Sunshine on the Great Wall of China.

Buy $

Sell $

Sell Short $

Buy Back $

Stop Loss $

Profit / Losses

Duration

2.50


2.11


 images

Reason for Buy / Sell / Sell Short / Buy Back:


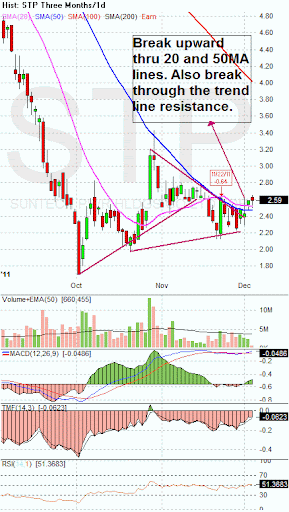
  1. Daily chart shows a start of uptrend at the price of $2.50.
  2. It has released its quarter announcement. So, should not have a lot of surprises.
  3. Daily chart shows that its price has poke through upward the 20MA and 50MA lines. Also taken out the trend line.
  4. Daily and weekly MACD doing bullish cross, a very positive sign.
  5. Weekly chart shows that price seems to bottom at $2.00.


Lesson Learnt:


  1. My entry sucks again. I should have know better to set at $2.40. Again, emotion kills.


Intraday Chart

clip_image001


Historical Chart

clip_image002


clip_image003

Tuesday, December 6, 2011

5th Dec 2011–My Analysis

BULL or BEAR ??


Short term (1 week)

Notes

clip_image001


-- The market had a few good rally days last week. All MA lines previous broken have been recovered in just one single week. This is a very bullish indicator.
-- Long term monthly charts for all 3 indexes are still healthy and remain at its uptrend. The bear has not managed to kill its uptrend.
-- Watch out VXX movement at its 20MA and 50MA lines.
-- Baltic shipping indexes are still healthy. Shipping stocks can be good opportunity when economy recover.
-- UUP is still in its uptrend. Be careful about it.
-- USO is still healthy in its uptrend indicating the positive movement in economy.
-- All sector ETFs are coming to their resistance trend lines. Watch out how they react to those lines.


clip_image002


SPY (30 years monthly) chart:


clip_image003


Input:


  1. As shown in the monthly chart, SPY is still staying on top of the 20MA line and the 120.00 line. Overall SPY is still healthy and uptrend is still intact until it is broken.


Next Week Economic Data (1 week):


clip_image004


Input:


  1. Not much data next week, except on Thursday.
  2. This time the BOE and ECB announcement can be important since all the problems are from Europe now.


VXX chart:


clip_image005


Input:


  1. Weekly chart shows that it is now resting at the support trend line of previous high and the 20MA line. This can be a bit dangerous.
  2. Daily 20MA has crossed up 50MA line and value has been surfacing at the 20MA line. This is not a good sign for the equity market in the long run.
  3. Its next support line is at 50MA line.


SPY chart:


clip_image006


Input:


  1. Daily SPY chart shows that it is facing resistance from the 200MA line and the trend line. Correction is a healthy reaction.
  2. This is an extraordinary week. SPY overtook back all the MA lines that it lost a week ago. Such a rally is impressive.


DJIA chart:


clip_image007


clip_image008

Input:


  1. DJIA has overtook all the MA lines again in just one single week.
  2. Currently facing resistance at the trend line. Correction is healthy.
  3. Monthly chart shows that DJIA is still above its 20MA and year 2000 high trendline.


NASDAQ chart:


clip_image009


clip_image010

Input:


  1. Similarly NASDAQ has done a good rally in a week time. Overtook all MA lines previously lost.
  2. Monthly chart shows that overall direction is still healthy. Value still stay above its 20MA line.


UUP chart:

clip_image011


Input:


  1. UUP daily chart shows that uptrend is still intact. This is not that good for equity.


Sector Analysis:


clip_image012


Input:


  1. Many sectors have reached their resistance trend lines. Correction is expected.


Copper JJC  chart:


clip_image013


Input:


  1. Monthly chart shows that JJC is indicating rally but its long term down trend still remain.


GLD and SLV charts:


clip_image014


clip_image015


clip_image016


clip_image017


Input:


  1. Monthly GLD chart shows that GLD is still healthy at its uptrend but daily GLD chart shows that it is facing resistance from its trend line.
  2. SLV monthly chart shows that it is coming to the 20MA support line even though it is still in its downtrend.


 Petrol and Natural Gas charts:


clip_image018


clip_image019


Input:

  1. USO uptrend is still intact.
  2. UNG downtrend is still not done yet.


FXI (iShares FTSE / Xinhua China 25 Index Fund) chart:


clip_image020


Input:


  1. Similar to all indexes, FXI has overtook all the MA lines previously lost.
  2. Very bullish signal.


Baltic Dry Index chart:


clip_image021


Input:


  1. Shipping index still looks healthy, however, shipping stocks are falling like rocks. There are a lot of opportunities on shipping stocks when the economy recover. Keep monitoring them.