Showing posts with label A. Show all posts

Sunday, May 3, 2020

3rd May 2020 - "A" grade ain't mean you are good.


Reason to Watch
  • So many chances to short, but all missed!
Lesson Learnt:
  • There are so many chances to short for Agilent.
  • Here comes another one. Let's see whether I have the time and chance to bite it.
Intraday Chart


Historical Chart


Wednesday, March 4, 2020

4th Mar 2020 - Hard to get A+ on this exam.


Buy $
Sell $
Short $
Cover $
Stop Loss $
Profit / Losses


$82.04
3rd Mar 2020

profit 

Reason to Cover
  • The bounce-back capability of this stock demonstrated yesterday is stronger than I expected. It is time to protect more on my profit
Lesson Learnt:
  • I actually moved down the cover price just to make sure my profit is more.
  • FED actually came out (outside of their scheduled time) and cut rate by 0.5 after I went to bed. Great that I protected my profit more, else it could have kicked me out around $85.00.
  • Anyway, the market turned back down even though FED cut rate.
Intraday Chart

Historical Chart


Tuesday, March 3, 2020

3rd Mar 2020 - My A+ has become A-


Reason to Watch
  • I am still holding the short, but the price is threatening my profit.
Lesson Learnt:
  • Let's see whether it can poke through the second resistance line. I have to admit that it is quite strong.
  • Let's see whether the "money flow" statistic is reflecting the right picture of not. According to the chart, selling seems to be more than buying.
Intraday Chart


Historical Chart


Saturday, February 29, 2020

29 Feb 2020 - Show your strength... if you dare.


Reason to Watch
  • I  am still shorting this stock.
Lesson Learnt:
  • See how similar A stock behave like the DJIA index?!
  • Last-minute rebound in A stock seems like a strong one. We will see how long it can last.
  • May have to cover soon if it start to show strength, together with the index rebound.
  • You can actually compare the weekly chart of A stock with the weekly chart of the DJIA weekly chart. You can't recognize which is which if I removed its label.
Intraday Chart


Historical Chart


Monday, February 24, 2020

21st Feb 2020 - "A" is not enough, we aim "A"+


Buy $
Sell $
Short $
Cover $
Stop Loss $
Profit / Losses


$85.00
21st Feb 2020

$84.00


Reason to Short
  • This is a top up to my short on A.
  • Expect it to come to the MA line and stop there and hopefully it will start to drop from there.
Lesson Learnt:
  • This time I was right at the price setting. It came all the way up to the MA line.
  • Be careful. A stock can still go until $85 while DJIA is dropping still mean that it is pretty strong.
Intraday Chart


Historical Chart


Friday, February 21, 2020

19th Feb 2020 - Aiming for grade "A".

Buy $
Sell $
Short $
Cover $
Stop Loss $
Profit / Losses


$ 84.07
19th Feb 2020


Reason to Short
  • After earning, price try to go higher, but faced with sellers, then price start to show weakness.
  • It is starting to poke down the trend line and getting very similar to the bearish chart pattern posted previously.
Lesson Learnt:
  • Again, I was trying to short at a higher price, but then I could not hold my temptation and chase it down. Bad decision.
Intraday Chart


Historical Chart


Wednesday, February 19, 2020

19th Feb 2020 - It is "A" perfect match.


Reason to Watch
  • It is a very familiar bearish chart pattern.
  • It is interesting to see that they are still some buying spree aftermarket and not a very direct drop continuously.
Lesson Learnt:
  • Time to learn how this chart pattern works out.
Intraday Chart


Historical Chart


Wednesday, May 31, 2017

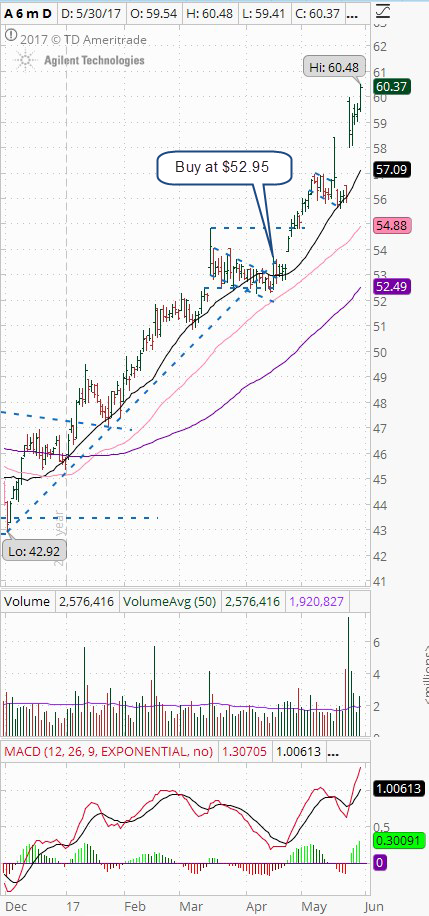
18th April 2017 - Look for the sparkling logo…

    Buy $

    Sell $

    Short $

    Cover $

    Stop Loss $

    Profit / Losses

    Duration

    52.95 (top up)


    tempReason for Buy / Sell / Short / Cover:


    1. It is a very beautiful flag just like what you can read from Alexnader Elder's stock bible.
    2. The overall Dow Jones index was ok.


    Lesson Learnt:


    1. That was a good call.
    2. I am glad that I set a purchase line and that purchase line is quite close to the price when it is at around 11:30pm.


    Intraday Chart

    clip_image001


    Historical Chart

    clip_image002

Wednesday, January 11, 2017

11th Jan 2017 - Look closer and you will see them.

    tempPattern Study


    1. If you look carefully, there are so many stocks that have the same pattern as stock "A". This time is "TROX".
    2. It is very obvious that "TROX" advanced earlier than "A" and hence become a mirror for "A".


    What should I do?


    1. If "A" comes back to $48.00, it could be a good entry.


    Chart 1

    Chart 2

    [clip_image001%255B6%255D.jpg]

    clip_image002


11th Jan 2017 - Another mirror for A also starts with A


    Pattern Study


    1. Comparing stock "A" and stock "AIG"
    2. Stock "A" seems to act as a mirror for stock "AIG" or vice versa.
    3. Stock "A" seems to start its second kick to upside.
    4. Stock "AIG" has also started its second kick to upside.


    What should I do?


    1. Good entry for AIG should be at $67.00


    Chart 1

    Chart 2

    clip_image001


    clip_image002


Saturday, January 7, 2017

7th Jan 2017 - A is a good mirror for STM

    Pattern Studytemp


    1. Comparing stock "A" and stock "STM"
    2. Stock "A" seems to have progress further and act as a mirror for stock "STM".
    3. Stock "A" seems to start its second kick to upside.
    4. Stock "STM" seems to retrace its first uptrend.


    What should I do?


    1. Might be a good entry at around $10 for stock "STM".


    Chart 1

    Chart 2

    clip_image001

    clip_image002

Saturday, April 21, 2012

20th April 2012 - “A” play trick with me.

Buy $

Sell $

Sell Short $

Buy Back $

Stop Loss $

Profit / Losses

Duration


41.60


Profit


Reason for Buy / Sell / Short / Cover:


  1. Set a stop loss right underneath the daily mountain shape support line.
  2. Got hit, triggered and the stock price rebounded back.      ;-(


Lesson Learnt:


  1. This could be a pretty bad stop loss.
  2. Should have sold it when it first broke down from the daily 50MA line.
  3. Anyway, there is potential shorting opportunity once it rebound back to around $44.00. A potential head-n-Shoulder in the making.


Intraday Chart

clip_image001


Historical Chart

clip_image002

Tuesday, March 13, 2012

13th March 2012 – Pattern Study – Long spring board

images Ticker:


  1. A


Topic:


  1. Agilent produce long spring board.


Lesson Learnt:


  1. Agilent is producing a 10 year long spring board and is ready to launch.
  2. Price is above the long term 20MA line.
  3. Resistance line and up trend line just met with each other.


Intraday Chart

-NA-


Historical Chart

clip_image001


clip_image002

Thursday, February 16, 2012

16th Feb 2012 – Pattern Study - “A” knee jerk.

Ticker:


  1. A


Topic:


  1. 5% dropped after earning announcement.


Lesson Learnt:


  1. This is the beauty of the stock market. From the mid of Dec 2011 till now, A stock has rallied 36% and now the earning has just dropped it 5%. There are still a lot of margin to play with.
  1. Overall the chart still look healthy. In fact, I am thinking that the opportunity for top up is coming soon around $39.00.
  2. I believe this stock is still a HOLD. Should be good for a long term play.


Intraday Chart

clip_image001


Historical Chart

clip_image002


clip_image003