Showing posts with label VXX. Show all posts

Saturday, September 2, 2017

2nd Sept 2017–Bad Attitude Index, don’t mess with me!


Buy $

Sell $

Short $

Cover $

Stop Loss $

Profit / Losses

Duration


48.00


Commission Fees

4 Days


tempReason for Buy / Sell / Short / Cover:

  1. Stop loss triggered.
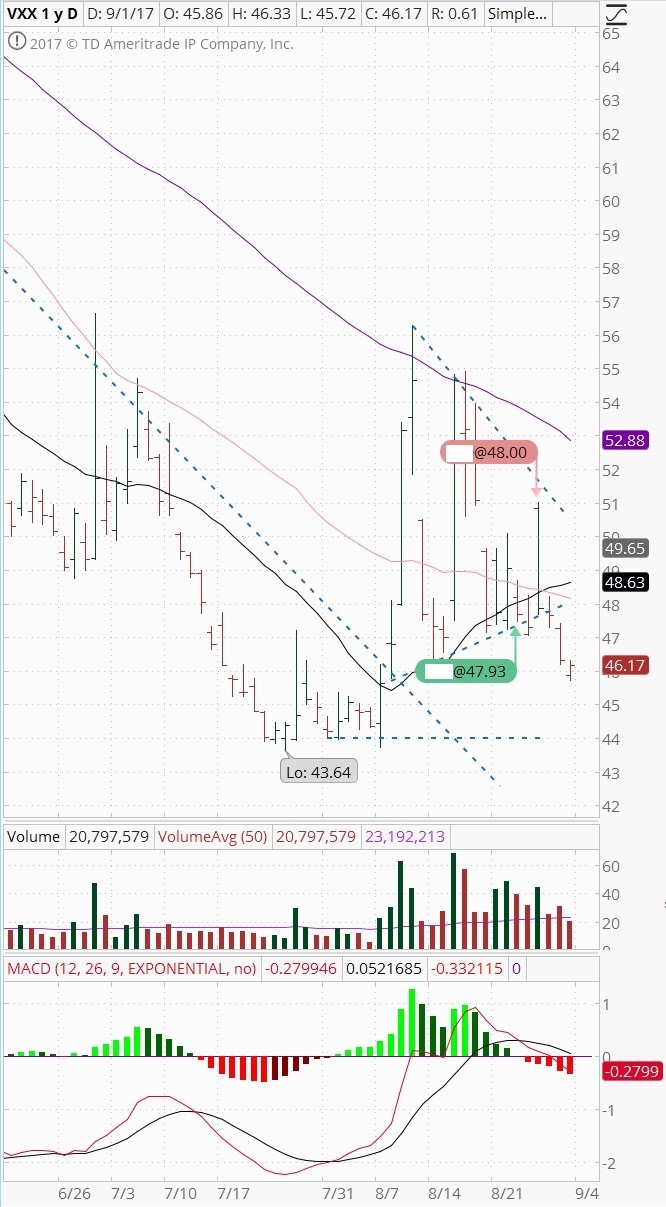
  2. The Korea missile only create a false alarm during the off market time. Next day everyone take opportunity to buy!


Lesson Learnt:

  1. I could have sell it at a higher price. I was hesitating.
  2. Glad to have the stop loss in place. As I have mentioned, this is a very scary index.
  3. Continue to watch this indicator especially when it comes to $44.00.


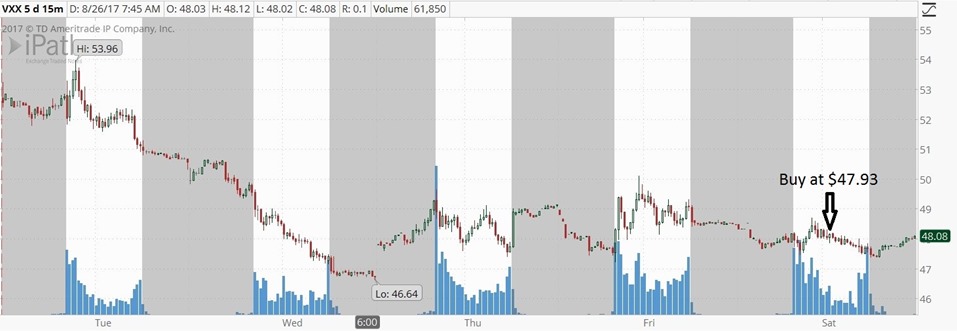
Intraday Chart

clip_image001


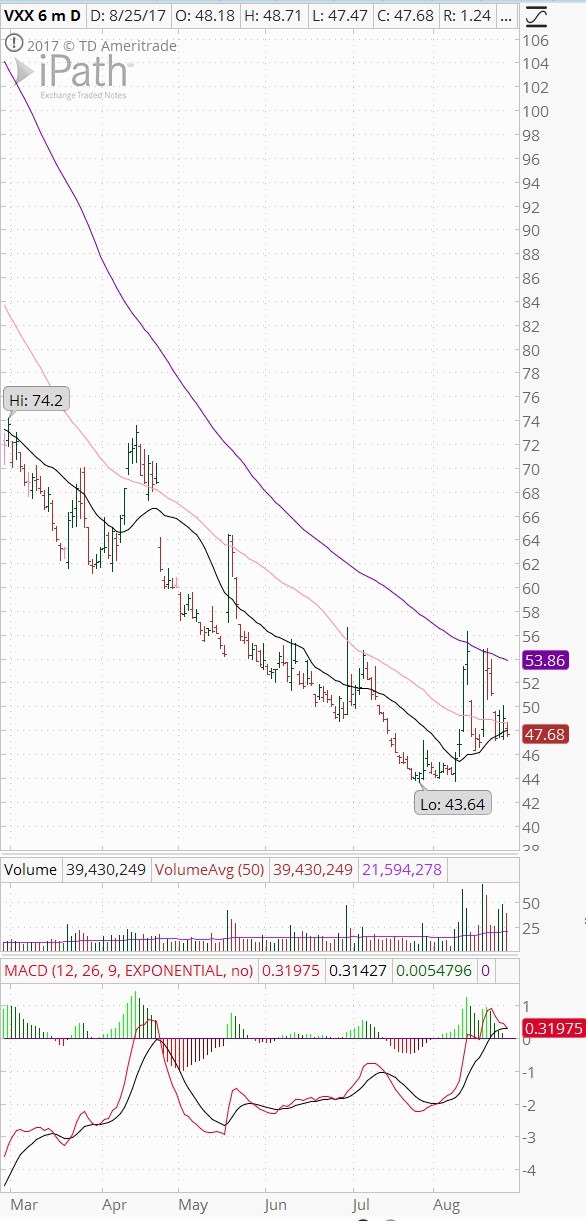
Historical Chart

clip_image002


Sunday, August 27, 2017

27th Aug 2017 -


Buy $

Sell $

Short $

Cover $

Stop Loss $

Profit / Losses

Duration

47.93


tempReason for Buy / Sell / Short / Cover:

  1. To me, many giant stocks have indicate selling trend.
  2. Long term chart showed a very scary volume.


Lesson Learnt:

  1. I could have set a much lower purchase price. Not patience enough again.
  2. This is a really scary one. Don't play play!


Intraday Chart

clip_image001


Historical Chart

clip_image002


clip_image003


Monday, July 16, 2012

16th July 2012 – My Analysis

BULL or BEAR ??


Short term (1 week)

Notes

clip_image001

-- It is quite surprising that German has to give way to the rest of the European country to agree with their bond purchase.

-- All 3 index charts have healthy long term charts, but all three of them are facing with their weekly 20MA line resistance.

-- GLD and SLV is again coming down to their support line at their 20MA line or trendline.

-- USO and JJC are still weak, but UUP and UNG react on uptrend.

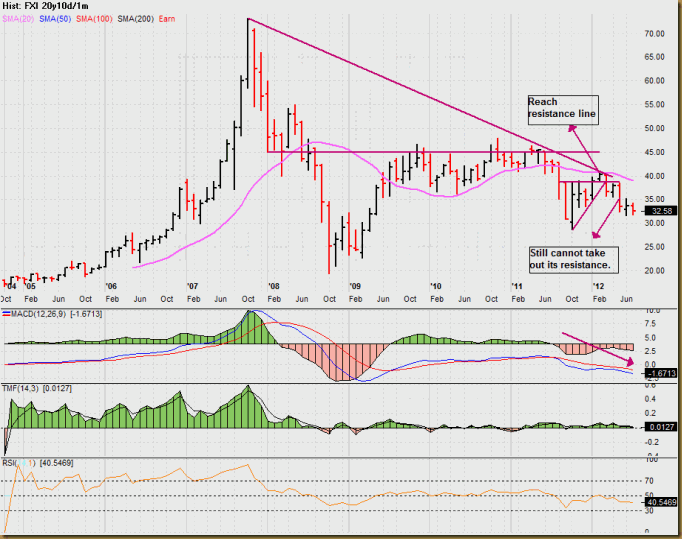
-- FXI is still showing more downtrend than uptrend.

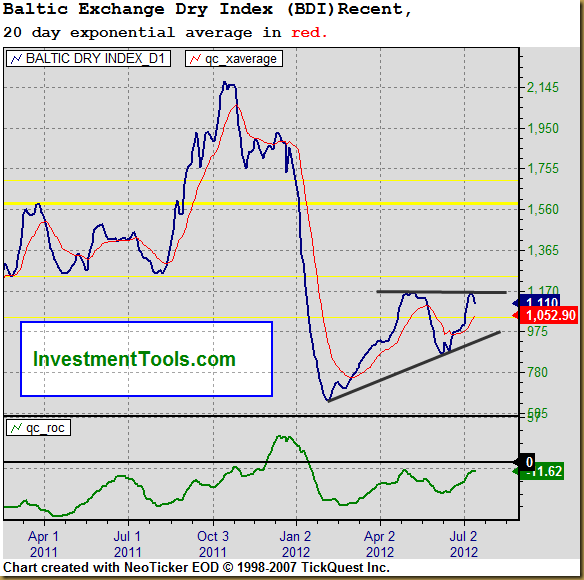
-- Shipment is still slowly in its uptick.

-- All sectors are approaching their resistance lines.

-- More scary economic data for the entire week.

-- It is interesting that VXX keeps making new low. How low can it go some more?


SPY (30 years monthly) chart:


clip_image002


Input:


  1. Long term SPY chart looks healthy.


Next Week Economic Data (1 week):


clip_image003


Input:


  1. Economic data coming out almost everyday. Looks like it is going to be a volatile week.


VXX chart:
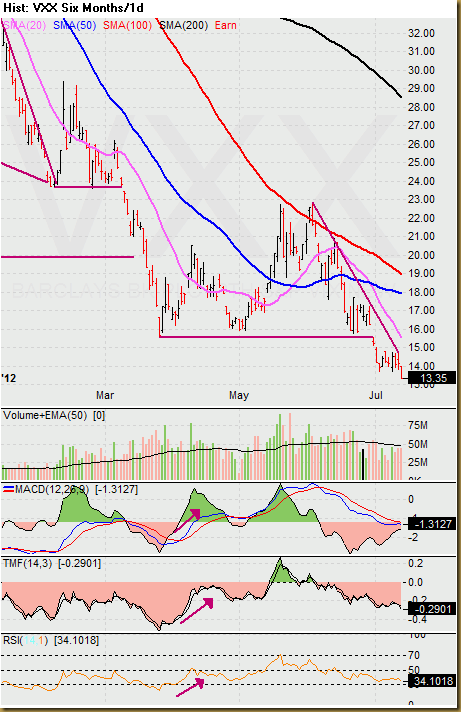
 

clip_image004


Input:


  1. VXX keeps making new low. Are we going towards a real big bull market?


SPY chart:


clip_image005


Input:


  1. SPY has again came back up to its weekly 20MA line.
  1. It may not be able to break this resistance line at this moment.
  1. Friday's one night rally was big and interesting.


DJIA chart:
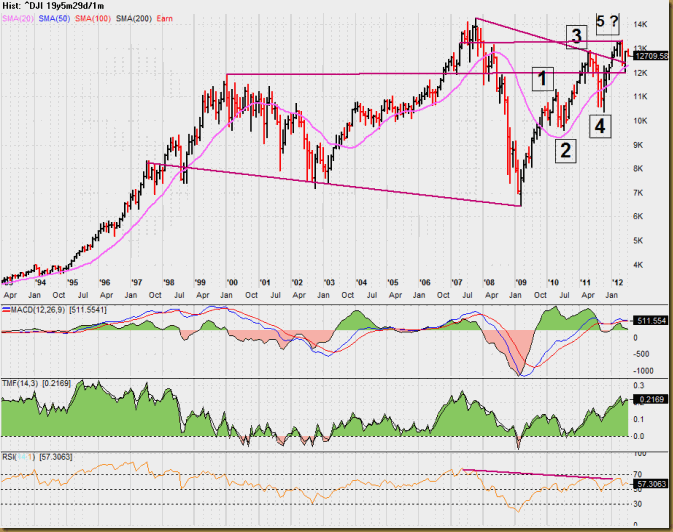
 

clip_image006


clip_image007


Input:


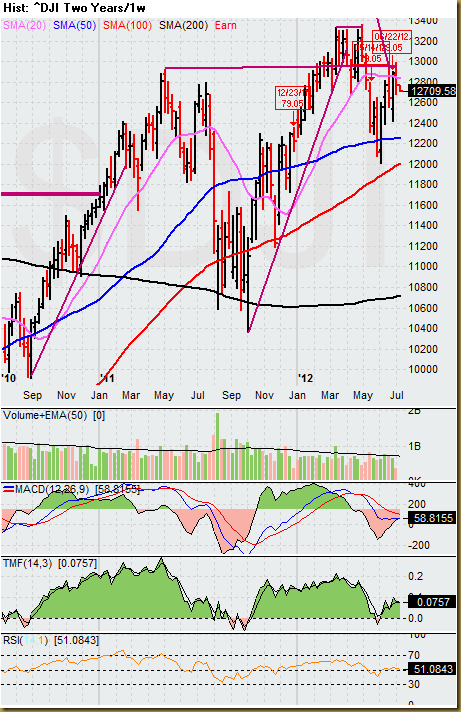
  1. Similar to SPY, long term DJIA is still healthy, but weekly chart shows that temporary it may not have the power to overtake the weekly 20MA line resistance despite Friday's big rally.


NASDAQ chart:
 

clip_image008


clip_image009


Input:


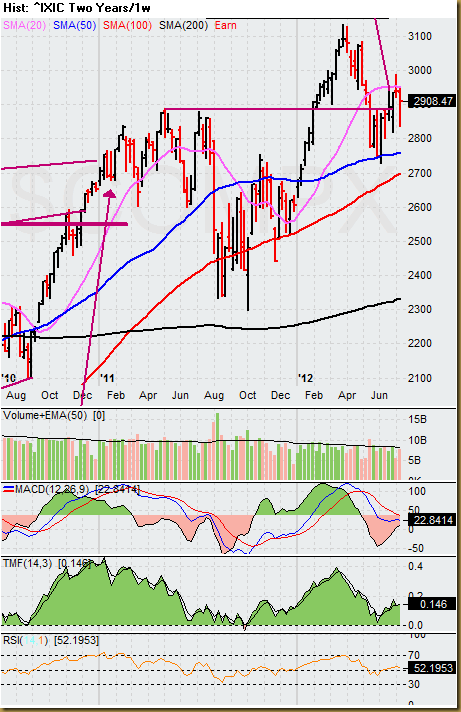
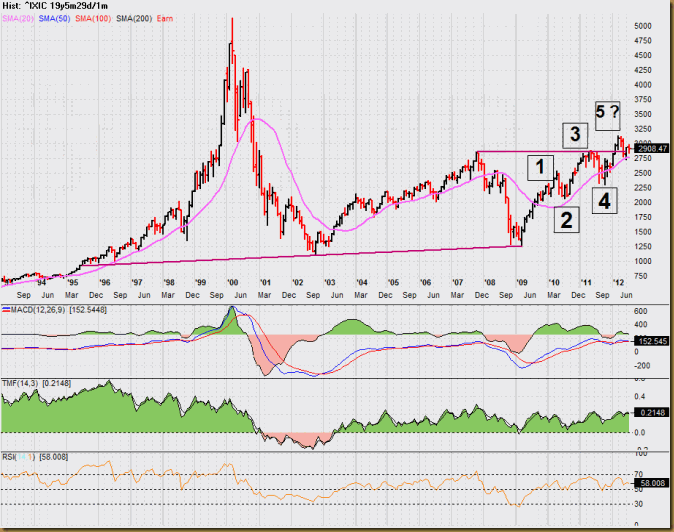
  1. Similar to SPY and DJIA both long and short term.


UUP chart:


clip_image010


Input:


  1. UUP uptrend still intact.


Sector Analysis:


clip_image011


Input:


  1. Many sectors are approaching their resistance line.


Copper JJC  chart:
 

clip_image012


Input:


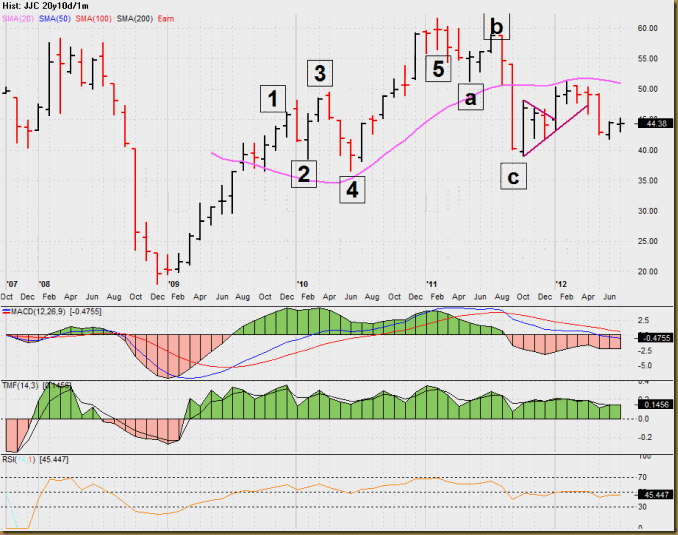
  1. JJC may not have reverse its downtrend. Secondary indicators are still weak.


GLD and SLV charts:
 

clip_image013


clip_image014


Input:


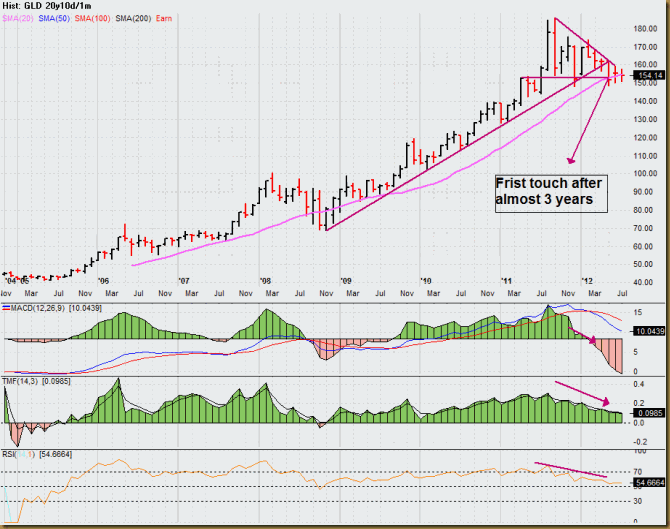
  1. GLD is sitting on its monthly 20MA line. All secondary indicators are showing more downtrend.
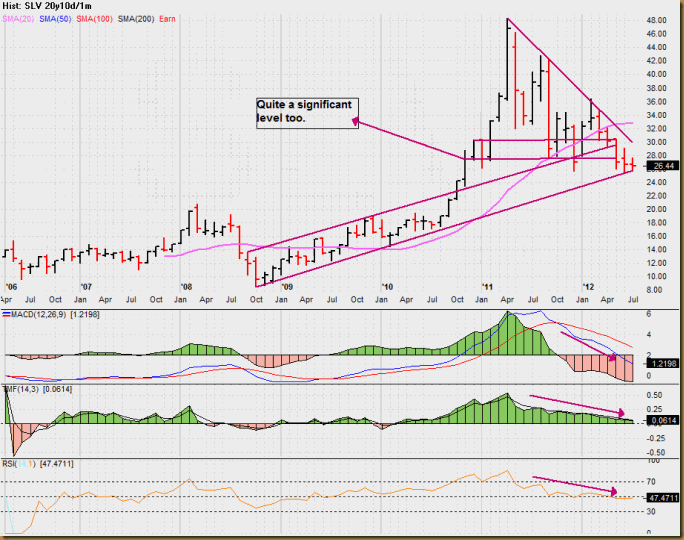
  2. Similarly, SLV is showing bearish trend. All secondary indicators indicating more downtrend is in the pipeline. Price now siting on the trendline.


 Petrol and Natural Gas charts:
 

clip_image015


clip_image016


Input:


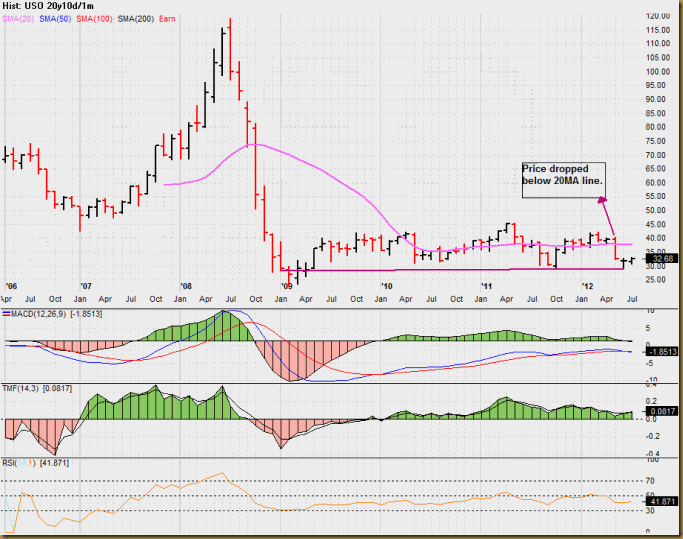
  1. USO is still relatively weak.
  2. UNG is still acting strong. Weekly chart shows that price is trying to break the resistance line of $20.00. All secondary indicators pointing for more upside movement. Volume is very encouraging.
  3. UNG could have bottomed at $15.00.


FXI (iShares FTSE / Xinhua China 25 Index Fund) chart:
 

clip_image017


Input:


  1. FXI is still weak. All secondary indicators are indicating more down trend is in the pipeline.


Baltic Dry Index chart:
 

clip_image018


Input:


  1. Uptrend is still intact.

Monday, June 25, 2012

25th June 2012 – My Analysis

BULL or BEAR ??


Short term (1 week)

Notes

clip_image001

-- It is interesting that market actually went crazy when I was not doing my homework for a month.

-- China FXI is still very weak and might be getting weaker.

-- All indexes clearly indicate strong resistance at their weekly 20MA lines and daily 100MA lines.

-- VXX is now at a triple bottom situation. Volume is also getting higher.

-- USO, GLD and SLV have came down to retest their trend line. Ben's announcement is also not encouraging to the Gold bugs.

-- The only weird one is the natural gas UNG. It has poke up through its weekly 20MA line again. This could well be a buy signal.

-- Thursday's jobless claim report can be very important to the market has mentioned by Ben the he will be watching job report very closely.

-- UUP has retest its upper part of trendline and retraced temporary,

-- Shipment index is again pointing downward.

-- Most sectors are showing mid term downtrend is still intact.
-- Expect the indexes to rebound back to maybe their daily chart 50MA line before another big drop.


SPY (30 years monthly) chart:


clip_image002


Input:


  1. Monthly chart shows that its 20MA line has been threaten once. Price rebound back above the 20MA line but not much.


Next Week Economic Data (1 week):


clip_image003


Input:


  1. Thursday data will be crucial.


VXX chart:


clip_image004


Input:


  1. Weekly VXX chart is again all time low and came out with a triple bottom. This is dangerous.


SPY chart:


clip_image005


clip_image006


Input:


  1. Looking at the weekly and daily chart of SPY, one should not be surprised with the big drop on Thursday. Were you?      ;-)
  1. A big resistance of 20MA line in the weekly chart and 100MA line in the daily chart has warned us very well.


DJIA chart:


clip_image007


clip_image008


Input:


  1. Similar to SPY. Just that DJIA is slightly stronger and gave you an illusion that its daily chart's 100MA line has been taken over.
  1. However, weekly chart has warned you that there is a big resistance line from the May'11 high.


NASDAQ chart:


clip_image009


clip_image010


Input:


  1. Similar to SPY and DJIA, but NASDAQ is much weaker among thee three.


UUP chart:


clip_image011


Input:


  1. UUP might have started to establish a reverse of its downtrend.
  1. Price has successful go above the monthly 20MA line. Will see how it comes back to the 20MA line.


Sector Analysis:


clip_image012


Input:


  1. Most sectors are still staying within the mid term downtrend with strong resistance from their 50MA lines.


Copper JJC  chart:


clip_image013


Input:


  1. Copper's downtrend continues. Price has again came down to test its trend line.
  1. Monthly MACD is still pointing more downward potential is building up.


GLD and SLV charts:


clip_image014


clip_image015


Input:


  1. GLD has again broke down its monthly 20MA line. Monthly GLD chart shows that all secondary indicators are all going downward and weak.
  2. SLV is even weaker. Came out with a multiple bottom. All secondary indicators are pointing more downward potential.


Petrol and Natural Gas charts:


clip_image016


clip_image017


Input:


  1. USO is very weak too. A three year multiple bottom chart is now in front of us. Price is also below its monthly 20MA line.
  2. UNG is the only one that is indicating something else. Good volume has started to come in and price has broken through the weekly 20MA line twice. A W bottom shape seems to be in the making.
  3. UNG can be a very good long candidate.


FXI (iShares FTSE / Xinhua China 25 Index Fund) chart:


clip_image018


Input:


  1. China is only showing more weakness. All secondary indicators continue their downward moves.


Baltic Dry Index chart:


clip_image019


Input:


  1. Shipment has again dropped below trend line and its 20MA line.

Monday, May 7, 2012

7th May 2012 – My Analysis

BULL or BEAR ??


Short term (1 week)

Notes

clip_image001

-- Daily charts for all 3 indexes are showing short term weakness. Should expect at least short term correction. Long term trend is still healthy.

-- GLD and SLV seems to indicate downturn already.

-- FXI is still weak, price still not able to overtake its resistance line.

-- USO suddenly got hit and price fall below its monthly 20MA line.

-- UNG shows some color this time.

-- Copper has shown weakness again.

-- Baltic index is still improving, but many shipping stocks are making correction from their previous big rally.

-- Almost all sectors are falling out of its trend line or its 50MA lines.

-- VXX completed its double bottom. Quite dangerous for stock market.


SPY (30 years monthly) chart:


clip_image002


Input:


  1. For entire April month, SPY is not able to break out the March high.
  1. Long term wise, SPY is still healthy.


Next Week Economic Data (1 week):


clip_image003


Input:


  1. Not much data in the pipeline at all for the entire next week.
  1. All index technical charts should follow what it is suppose to do.


VXX chart:


clip_image004


Input:


  1. Daily VXX chart indicating that it has completed a double bottom formation which is bearish for the stock market.
  1. Its 20MA line is still its resistance line.
  1. All secondary indicators are starting to show strength.


SPY chart:


clip_image005


Input:


  1. Value of SPY has dropped below both its daily 20MA and 50MA lines. Value now sitting on the neckline support line.
  1. All secondary indicators are not doing very well, pointing South.


DJIA chart:


clip_image006


clip_image007


Input:


  1. Long term wish, DJIA is still healthy.
  1. Weekly chart shows that it will most probably drop to its weekly 20MA support line again.


NASDAQ chart:


clip_image008


clip_image009


clip_image010


Input:


  1. Long term wise, NASDAQ is still healthy.
  1. Weekly and daily chart indicate that it has pretty high chances of dropping to 2900.
  2. All secondary indicators are going South.
  3. Value has dropped below its daily 20MA and 50MA again and now sitting on the neckline support line.


UUP chart:


clip_image011


Input:


  1. UUP movement is still stuck between its triangle formation. Uptrend is still intact. However, all secondary indicators are showing weakness.
  2. Be careful, UUP movement is going to affect my intention to short GLD and SLV.


Sector Analysis:


clip_image012


Input:


  1. Almost all sectors are falling out of its trend line or its 50MA lines.


Copper JJC  chart:


clip_image013


Input:


  1. Copper has again show weakness. Price has dropped below trend line and its weekly 20MA line again. All secondary indicators are not making much improvement too.


GLD and SLV charts:


clip_image014


clip_image015


clip_image016


Input:


  1. All the secondary indictors for GLD in the weekly and monthly charts are showing more and more downward movement.
  1. SLV weekly chart has again dropped through its support trend line at $29.00 and also its weekly 100MA line. All secondary indicators are also moving more and more downward.
  1. It is time to short GLD and SLV. Watch out for a good entry.
  1. However, watch out for UUP movement.


 Petrol and Natural Gas charts:


clip_image017


clip_image018


clip_image019


Input:


  1. Natural gas has shown some color this time. I was late to catch it.
  1. Price has again punched through the 20MA line, but face resistance from 50MA line.
  1. Watch closely and look for good entry.
  1. USO has dropped below its long term monthly 20MA line.
  1. USO intraday chart shows a pretty drastic drop.


FXI (iShares FTSE / Xinhua China 25 Index Fund) chart:


clip_image020


Input:


  1. FXI shows that it has not been able to take out the resistance line.


Baltic Dry Index chart:


clip_image021


Input:


  1. Shipment index is still going up. Impressive!
  1. Be careful, many shipment stocks actually making correction.