 Ticker:
- MOBI
Topic:
- Long term Multiple Bottom
Lesson Learnt:
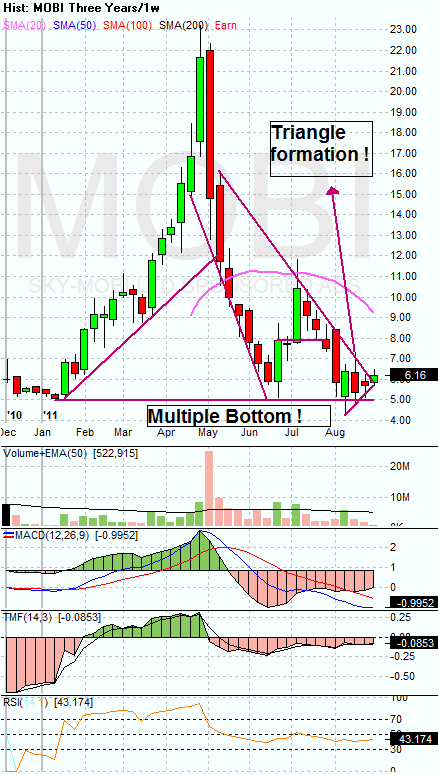
- Multiple bottom formation with triangle formation at the end. Price already came out from triangle formation and going upwards.
- Intraday bullish cross of 20MA and 50MA lines with price stick to 20MA line.
- Wait for a pullback for intraday for safer entry.
| Intraday Chart |
| 
|
| Historical Chart |
| 
|
 Ticker:
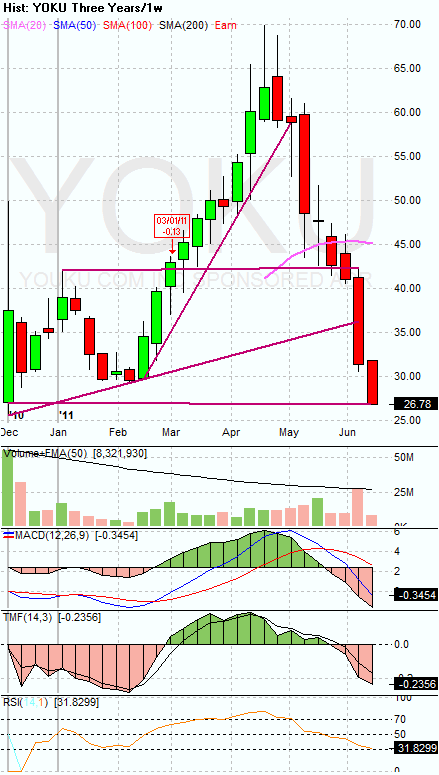
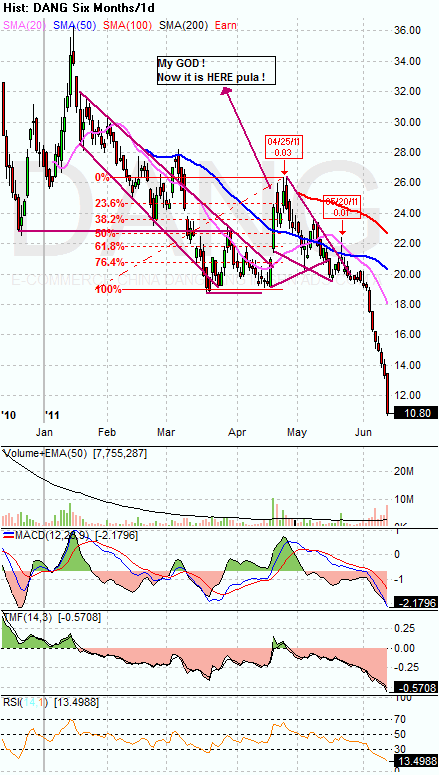
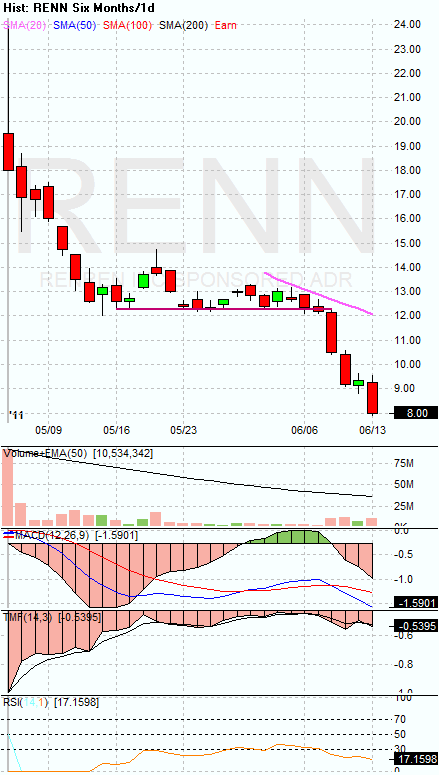
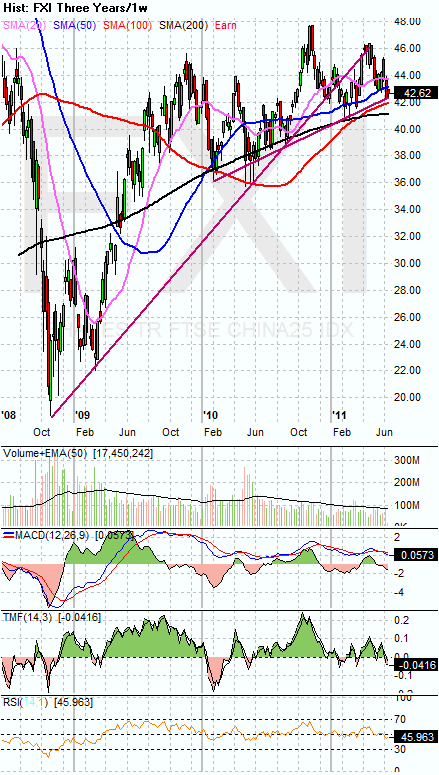
- YOKU, DANG, MOBI, RENN
Topic:
- Many China stocks are hit bad.
- Many below its IPO price.
Lesson Learnt:
- FXI is at critical junction.
- I read on MarketWatch before an article by an editor and he was very bearish on all China stocks before this happen. I could not find it now.
- Anyway, this is how opportunity is going to be created for LONG position in near future. Watch FXI and all indexes carefully for entry in all these interesting stocks.
| Intraday Chart |
| -NA- |
| Historical Chart |
| 
|

Ticker:
- MOBI
Topic:
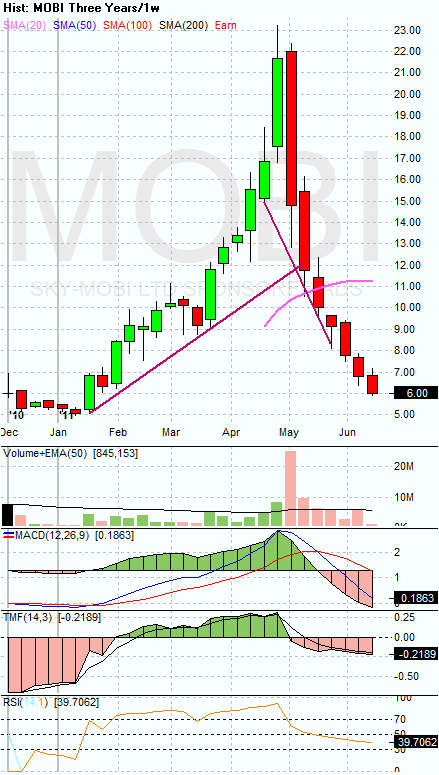
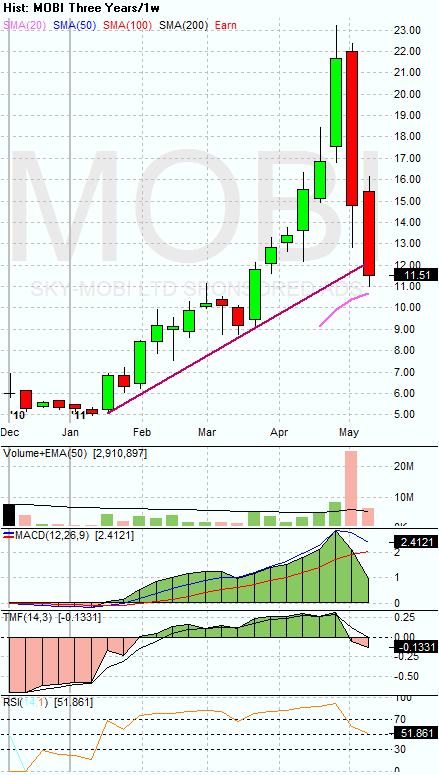
- Complete rise and Free Fall cycle.
Lesson Learnt:
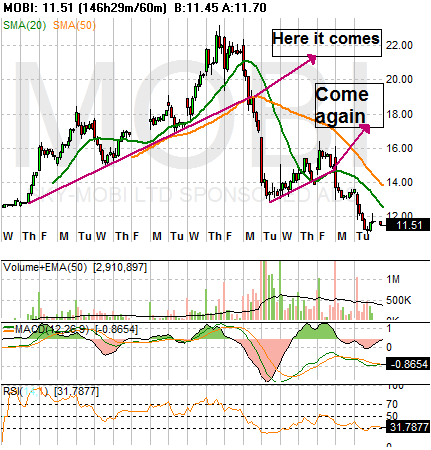
- Check out its parabolic rise just like SLV.
- Of course, check out how it falls like SLV too.
- See how it punch through the 20MA line, snap back rally at the 50MA line and then got into 20MA line resistance and then fall again. Next thing you know, it punch through the 50MA line and now it come to a touch down at its main support line at $11.00.
- Now the next $1M dollar question is, is this the BOTTOM?! If not, where will it be??
- The lesson is if you trade according to what the chart pattern tell you, you will keep earning. Everything is so expected.
- The entry point is coming soon. Keep an eye on it.
| Intraday Chart |
| 
|
| Historical Chart |
| 
|


