Showing posts with label AONE. Show all posts

Wednesday, February 23, 2011

23rd Feb 2011 – When AONE is no longer number ONE, just run…

Buy $

Sell $

Sell Short $

Buy Back $

Stop Loss $

Profit / Losses

Duration


9.61


9.61


2 weeks


Reason for Buy / Sell / Sell Short / Buy Back:


  1. Stop loss hit. Market correction was pretty bad.


Lesson Learnt:


  1. The beauty of stop loss save me some $$$.
  2. The drop was pretty bad indeed ---- 6%.


Intraday Chart

clip_image001


Historical Chart

clip_image002


Wednesday, February 9, 2011

9th Feb 2011 – Pattern Study - AONE

Ticker:


  1. AONE


Topic:


  1. Be patient and wait for your entry.


Lesson Learnt:


  1. I recorded this stock on 27th Jan 2011 and remind me to come back and check it out.
  2. Multiple support from all MA lines finally came in.
  3. Decide to get in seeing strong intraday activity.
  4. The symmetrical triangle is broken UP for the second time.
  5. Volume confirmation on-hand.


Intraday Chart

clip_image001


Historical Chart

clip_image002


clip_image003

Thursday, January 27, 2011

27th Jan 2011 – Pattern Study - AONE

Ticker:


  1. AONE


Topic:


  1. Triangle Symmetrical.


Lesson Learnt:


  1. This pattern shows a failed symmetrical triangle pattern that may try to rebuilt.
  2. Keep an eye on this. I believe it will punch through to the upside soon and could be pretty profitable.
  3. Daily chart reveals that multiple MA lines are providing support to its price.


Intraday Chart

-NA-


Historical Chart


    clip_image001


    clip_image002

Wednesday, November 3, 2010

3rd Nov 2010 – My car battery leaks…

oil Input:


  1. This is a GOOD example of my good control in stop loss.


Buy $

Sell $

Sell Short $

Buy Back $

Stop Loss $

Profit / Losses


9.50


Reason for Buy / Sell / Sell Short / Buy Back:


  1. Stop loss was hit at $9.50
  2. Intraday chart seems to indicate a break of all the lines that I had. Think NO MORE!
  3. Daily chart also shows a lot of weakness. Looks like the breakout of the triangle cannot sustain.


Lesson Learnt:


  1. Good decision as far as NOW is concerned.
  2. We will get it back later (maybe)...


Intraday Chart

clip_image001


Historical Chart

clip_image002


clip_image003

Saturday, October 30, 2010

30th Oct 2010 – Weekly Position Review

BP (SHORT)

Input:


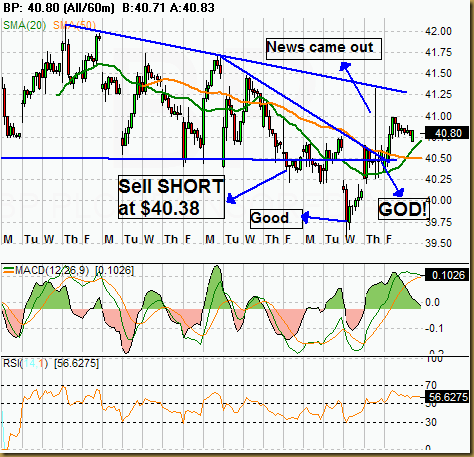
  1. Short term chart shows that position might be in danger.
  2. Above 20MA and 50MA line in intraday chart is not good for me as a "SHORTER".
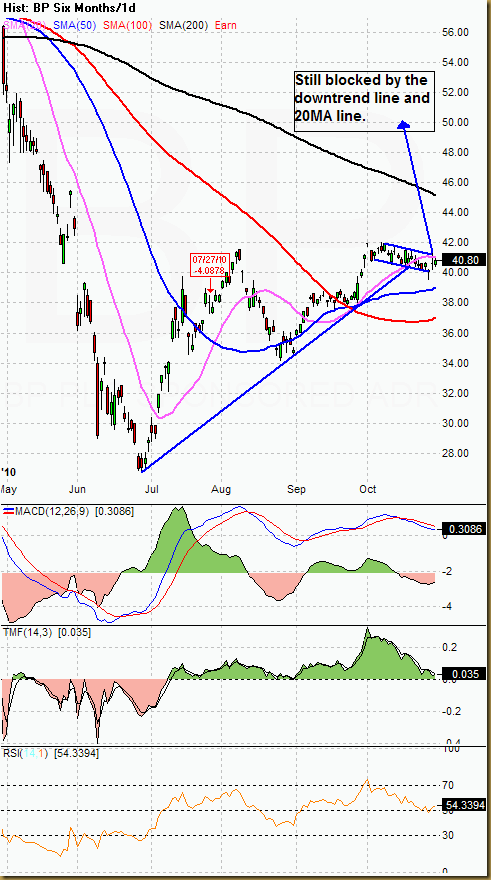
  3. Long term chart shows that it is still within the down trend line and also the 20MA line.


Buy $

Sell $

Sell Short $

Buy Back $

Stop Loss $

Profit / Losses


Reason for Buy / Sell / Sell Short / Buy Back:


  1. -NA-


Lesson Learnt:


  1. There are still a lot to learn on how to short at the best optimum price.


Intraday Chart

clip_image001


Historical Chart

clip_image002


clip_image003


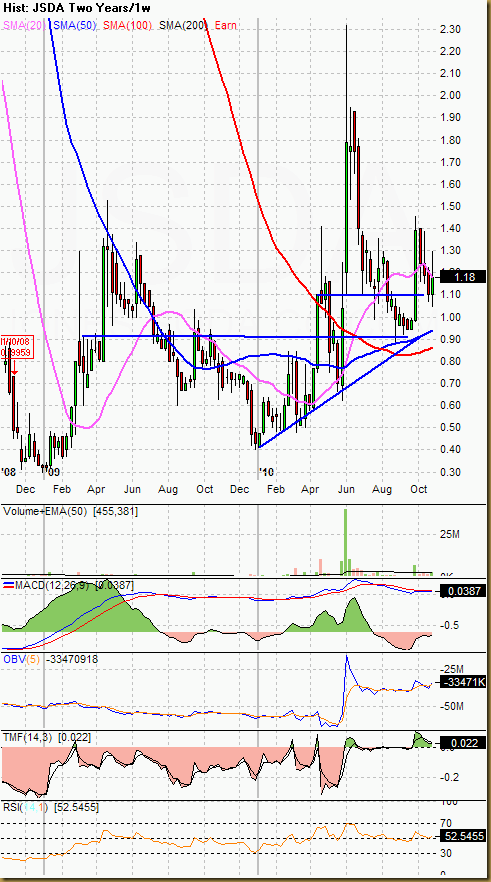
JSDA (LONG)

Input:


  1. Everything seems to be on track.
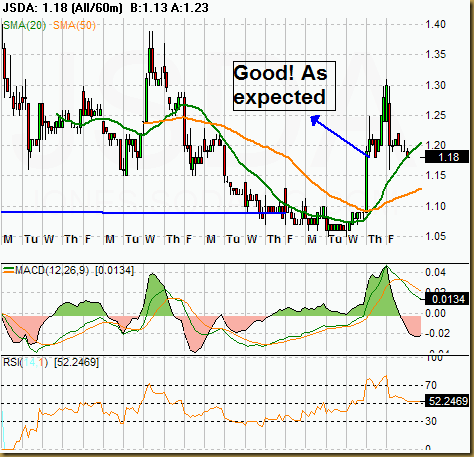
  2. Currently it retraced back to the intraday 20MA line which is what I expected as healthy for more rally next week.
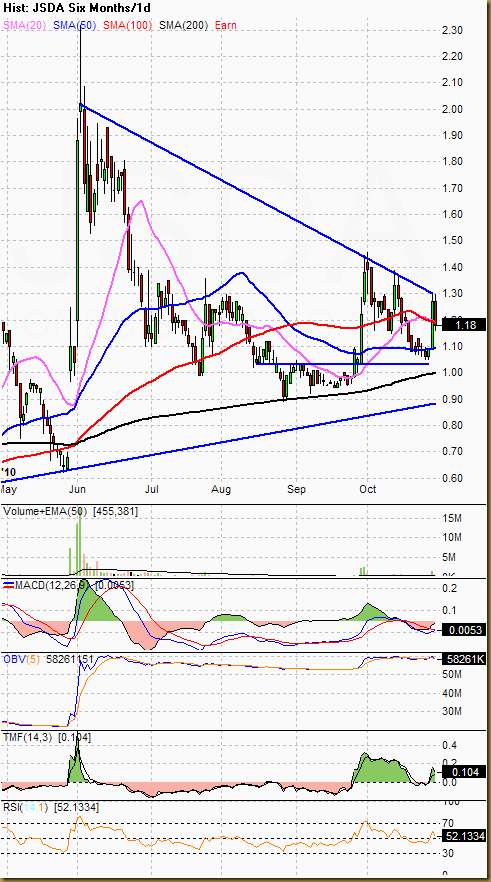
  3. Daily chart shows that it has resistance at the trend line at $1.30.
  4. Daily chart shows that it has support at 20MA and 100MA line.
  5. Weekly chart shows that it has a good mental support at $1.10.


Buy $

Sell $

Sell Short $

Buy Back $

Stop Loss $

Profit / Losses


Reason for Buy / Sell / Sell Short / Buy Back:


  1. -NA-


Lesson Learnt:


  1. My purchase point can be polished to be better.


Intraday Chart

clip_image001


Historical Chart

clip_image002


clip_image003

AONE (LONG)

Input:


  1. Weekly chart MACD looks good.
  2. Intraday pull back shows good extra loading point, if got $$$.
  3. Intraday chart shows price is currently supported by 20MA and 50MA line and the uptrend line.
  4. Another break above $10.00 will indicate strong long term rally.


Buy $

Sell $

Sell Short $

Buy Back $

Stop Loss $

Profit / Losses


Reason for Buy / Sell / Sell Short / Buy Back:


  1. -NA-


Lesson Learnt:


  1. Again, improvement needed for entry timing.


Intraday Chart

clip_image001

Historical Chart

clip_image002


clip_image003

Saturday, October 16, 2010

16th Oct 2010 – More analysis on AONE

Input:


  1. I should have done this analysis earlier.


Buy $

Sell $

Sell Short $

Buy Back $

Stop Loss $

Profit / Losses


Reason for Buy / Sell / Sell Short / Buy Back:


  1. -NA-


Lesson Learnt:


  1. Checking the daily historical chart might lead me to better entry price.
  2. Re-layout my Quote Tracker to display  ---- intraday, daily and then weekly chart all link up together.
  3. I probably should have read more news about this company before taking my shot.
  4. Next time have to check Google performance chart to find competitors and their performance.


Comparison Chart

clip_image001


Historical Chart

clip_image002


A bad comment on AONE:


clip_image003

Friday, October 15, 2010

15th Oct 2010 – Getting into car battery business. Am I too early?

Input:


  1. This is a "new-kid-on-the-block".
  2. Bottom seems to set in already - at $6.5


Buy $

Sell $

Sell Short $

Buy Back $

Stop Loss $

Profit / Losses

9.31


Reason for Buy / Sell / Sell Short / Buy Back:


  1. Weekly chart looks like breaking the downward trend already.
  2. Weekly chart also shows that it has just completed the consolidation phase.
  3. Weekly chart also shows that it is now sitting on the 20MA as support line.
  4. Long term chart MACD looks good.


Lesson Learnt:


  1. From the daily chart, clearly see that if I could have waited for it to touch the 50MA line, I will be in much better position. It shows again, my patient is not there yet.
  2. Just found out from FINVIZ that the Montley Fool comment was bad on this company. Refer to 10/13/2010 note.


Intraday Chart

clip_image001


clip_image002


Historical Chart

clip_image003