Showing posts with label C - CitiBank. Show all posts

Tuesday, March 24, 2020

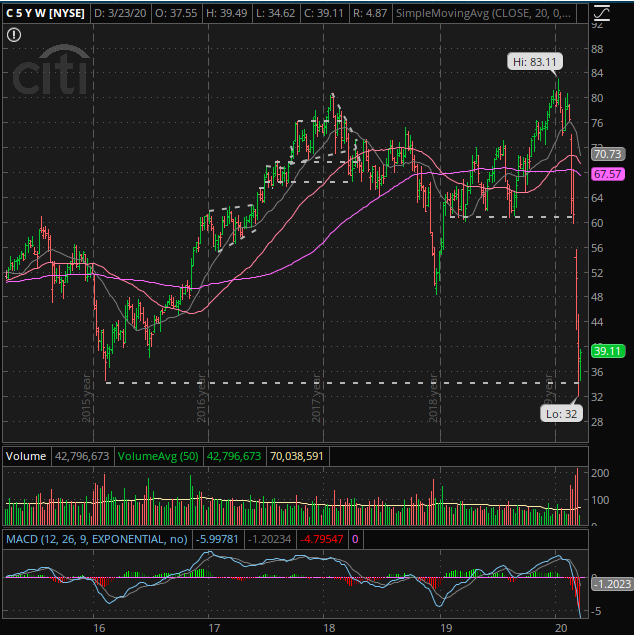
24th Mar 2020 - Is it safe to go Citibank during MCO (Movement Control Order)


Reason to Watch
  • After such a crash, take a good look at all the banks. One of them is of course CitiBank.
Lesson Learnt:
  • Such a perfect opportunity that I missed. Yesterday looks like is the best time to catch it.
  • Stupid me. Missed all the opportunity for all the fantastic short opportunities.
Intraday Chart


Historical Chart


Monday, July 16, 2012

16th July 2012 - Bad news == Good news !

Ticker:


  1. JPM, C


Topic:


  1. Bad news good for its stock.


Lesson Learnt:


  1. Sometimes bad news is much better than good news.


Intraday Chart

clip_image001


clip_image002


Historical Chart

clip_image003


clip_image004

Wednesday, June 27, 2012

27th June 2012 – Flex-C-bility ?!

Buy $

Sell $

Short $

Cover $

Stop Loss $

Profit / Losses

Duration


27.12


Even

1 month


Reason for Buy / Sell / Short / Cover:


  1. Price gapped down and gapped down below its daily 20MA line. All my profit was gone.


Lesson Learnt:


  1. Europe issues kept popping up and disrupt the market moves.
  1. I have not been working hard enough in the stock market recently. It is good to let go this one at even first. Will come back and haunt it again later.


Intraday Chart

clip_image001


Historical Chart

clip_image002

Thursday, February 2, 2012

2nd Feb 2012 – Pattern Study – Put your $$ in Citibank.

images Ticker:


  1. C


Topic:


  1. Put your $$ in Citibank.


Lesson Learnt:


  1. The price has penetrated the triangle formation and moving upward. It is also trying to penetrate the previous top resistance line.
  2. 50MA and 10MA lines are about to do the gold-crossing.
  3. All secondary indicators are shouting for entry.
  4. Volume is encouraging even though it is not high.
  5. If price brake above $32.00, it  will draw many buyers into the Citibank queue.


Intraday Chart

-NA-


Historical Chart

clip_image001

Saturday, September 3, 2011

3rd Sept 2011–Those people really know when to pick the time to sue the banks, right when I am in there.

Buy $

Sell $

Sell Short $

Buy Back $

Stop Loss $

Profit / Losses

Duration


28.30


Profit

10 days


Reason for Buy / Sell / Sell Short / Buy Back:


  1. US is sue all the 17 big banks for misconduct. Market before open already falling badly especially banks.
  2. Big profit gone with the wind in such a high speed.
  3. Take my profit and come back later.        ;-)


Lesson Learnt:


  1. Have to be more aggressive in protecting profit during bear market. Stop loss have to be adjusted close to avoid such a gap before market.
  2. Stock like C, BAC, GS, GOOG, you might not have to sell the stock so urgently. It tends to bounce back in the next half an hr. Sell then might get a bit of profit back.


Intraday Chart

clip_image001


clip_image002


Historical Chart

clip_image003

Wednesday, August 24, 2011

24th Aug 2011–Never give up on Citibank

Buy $

Sell $

Sell Short $

Buy Back $

Stop Loss $

Profit / Losses

Duration

27.60


24.90


imagesReason for Buy / Sell / Sell Short / Buy Back:


  1. It looks like there is support at intraday chart at 27.60.


Lesson Learnt:


  1. My entry point sucks again.     ;-(
  2. I should have waited until it touches $26.00 which is a perfect double bottom line for daily chart. With such a bear market, it should be able to get there.
  3. I should have waited for intraday price to poke through upward the 20MA line.


Intraday Chart

clip_image001


Historical Chart

clip_image002


clip_image003

Friday, August 19, 2011

19th Aug 2011–Dissatisfy customer of CitiBank

Buy $

Sell $

Sell Short $

Buy Back $

Stop Loss $

Profit / Losses

Duration


28.45


Losses

4 days


imagesReason for Buy / Sell / Sell Short / Buy Back:


  1. Market dropped badly 420 points.
  2. Citibank daily chart gapped down from its triangle consolidation pattern.


Lesson Learnt:


  1. Market turmoil might not end yet.
  2. Small amount entry did keep my losses minimum. Keep this practice until the market trend is properly setup.
  3. Make sure protect capital and ensure that $$ is available when the bull comes back in.


Intraday Chart

clip_image001


Historical Chart

clip_image002

Thursday, August 18, 2011

18th Aug 2011 - Let's withdraw some $ from CitiBank

Buy $

Sell $

Sell Short $

Buy Back $

Stop Loss $

Profit / Losses

Duration

30.80


27.83


imagesReason for Buy / Sell / Sell Short / Buy Back:


  1. Indexes dropped like crazy. Citibank announce quarter report and sink together badly.
  2. Very high volume for the latest bad drop.
  3. Broke thru all MA lines, all trend lines and now it is making 2 years low.
  4. Daily chart shows that it is forming a triangle consolidation pattern. Something I like.


Lesson Learnt:


  1. My entry point is still not good. I really have to be patient enough for the entry.


Intraday Chart

clip_image001


Historical Chart

clip_image002


clip_image003

Thursday, July 28, 2011

28th July 2011–Citibank chased me out!

Buy $

Sell $

Sell Short $

Buy Back $

Stop Loss $

Profit / Losses

Duration


38.50


Even

1 week


imagesReason for Buy / Sell / Sell Short / Buy Back:


  1. Stop loss triggered.


Lesson Learnt:


  1. I did not expect it to be so weak, come all the way down to hit my stop loss. But then I am glad with my stop loss setup.
  2. My stop loss point should actually be tuned higher yesterday, somewhere just below the 50MA line.
  3. Will monitor and come back and catch it again.    ;-)


Intraday Chart

clip_image001


Historical Chart

clip_image002

Wednesday, July 20, 2011

20th July 2011–Let’s rob Citibank again!

Buy $

Sell $

Sell Short $

Buy Back $

Stop Loss $

Profit / Losses

Duration

38.00


35.43


imagesReason for Buy / Sell / Sell Short / Buy Back:


  1. It has punched through the downtrend trend line and come back up rebound after making a short term double bottom and now it is sitting on the trend line again.
  2. It has announced its quarter report, should not see much volatility.


Lesson Learnt:


  1. Again, I am not patient enough to wait for my entry. Market was very bullish in the start and keep going strong.
  2. I should have know better that at price $38.00, there is the 20MA line that is blocking. A temporary wait will normally get me a better price entry.


Intraday Chart

clip_image001


Historical Chart

clip_image002