Showing posts with label Gold. Show all posts

Friday, September 2, 2011

02nd Sept 2011–Shorting the real GOLD

Buy $

Sell $

Sell Short $

Buy Back $

Stop Loss $

Profit / Losses

Duration


104.00


imagesReason for Buy / Sell / Sell Short / Buy Back:


  1. Intraday shows that it just came out of the small triangle formation and is heading South.
  2. Price is below both intraday 20MA and 50MA lines.
  3. Intraday 20MA and 50MA lines looks like going to do a bearish cross.
  4. Daily chart shows that 20MA line is broken even though the uptrend still intact.
  5. GLD chart also shows weakness. Patterns are so similar.


Lesson Learnt:


  1. If the short is successful, the next one to short will be GLD.
  2. Monitor GLD movement closely. This can be a tough short, but I think the time is kind of right already.


Intraday Chart

clip_image001


clip_image002


Historical Chart

clip_image003


clip_image004


clip_image005

Sunday, February 27, 2011

27th Feb 2011 – My Analysis

BULL or BEAR ??


Short term (1 week)

Long term (1 month)

clip_image001

-- SPY and NASDAQ have shown strong rebound.

-- DJIA has shown rebound even though its daily chart still under the 20MA line.

-- All 3 indexes still stay above its uptrend lines.

-- All sectors have shown rebound on their 50MA lines. XLE goes even much higher.

-- Not much economy data coming week.

-- Libya problem will only benefit USA.


clip_image002

-- FXI daily chart still in the downtrend.

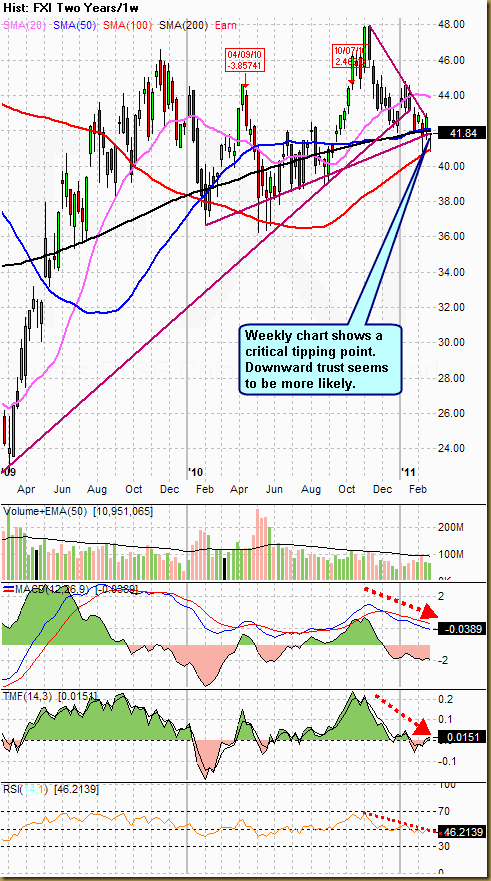
-- FXI weekly chart shows a very critical point now and downward thrust is more likely.

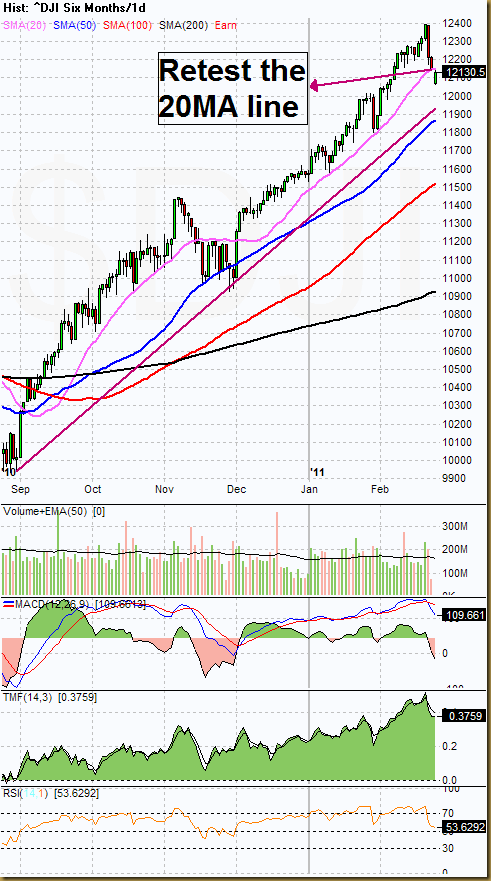
-- 20MA line is acting more like a resistance line for DJIA now.

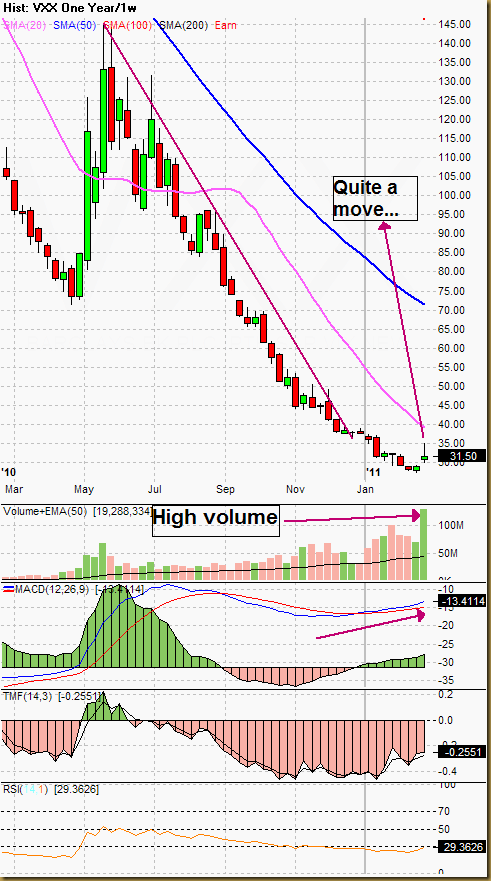
-- After about 4 months time, this is the first time VXX daily chart poke through the 50MA line and came back.

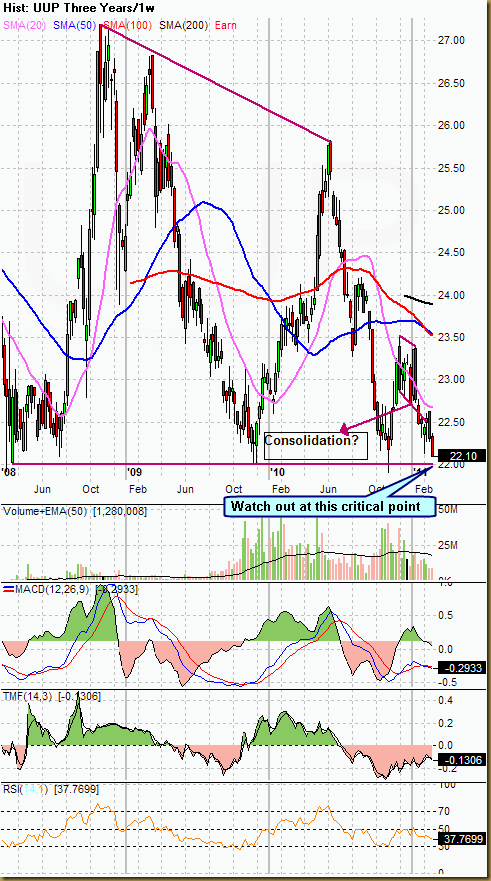
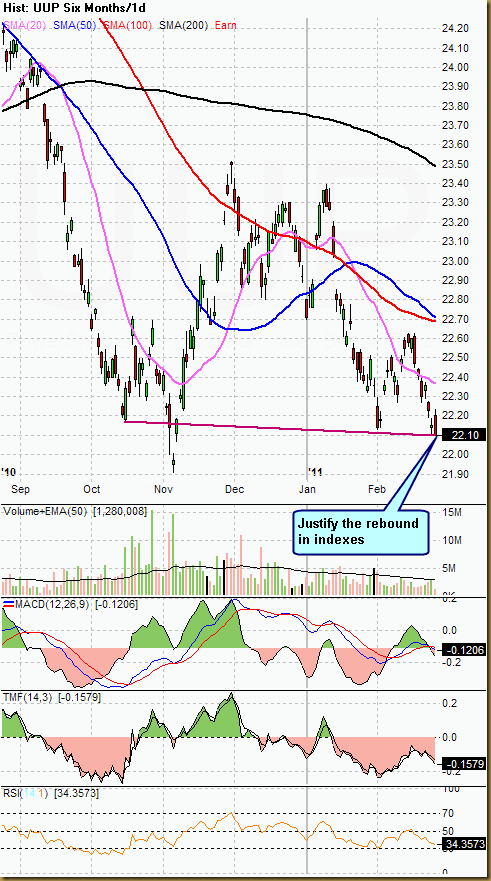
-- UUP is extremely close to the multiple bottom line.


Next Week Economic Data:


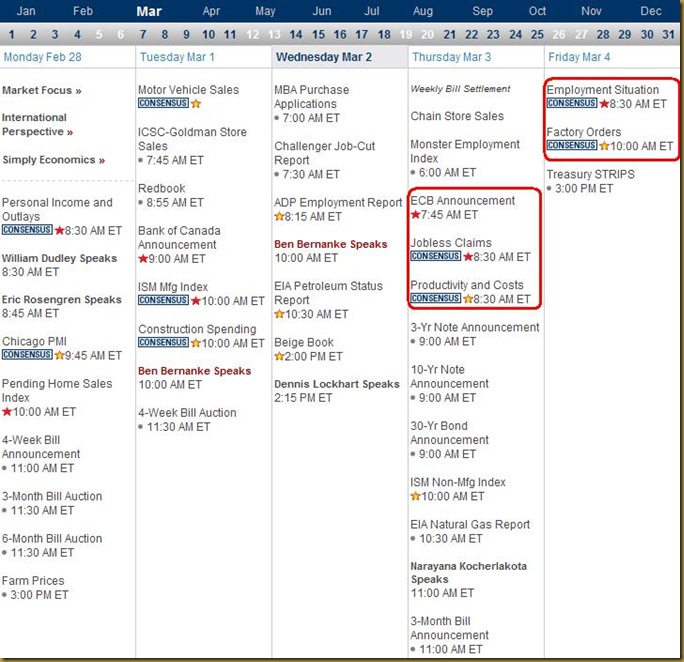
clip_image003


Input:


  1. Not much economy data is expected coming week, except on Thursday and Friday.
  2. Expect the current index rebound to continue in coming week.
  3. Now only depend on the Libya situation, but then again, the stock marker has basically digested that. Don't think that Libya situation is going to hurt the market anymore.


VXX chart:


clip_image004


clip_image005


Input:


  1. The stable down of VXX is actually expected.
  2. However, watch out when it comes to the 20MA line. If it is quite stable at 20MA line, market might be in danger.
  3. This is the first time it poke through the 50MA line after such a long time. This might be a hint for the BULL.
  4. High volume and upward MACD on the weekly chart shows that a change of direction might be in place soon.


SPY chart:


clip_image006


clip_image007


Input:


  1. SPY daily and weekly char all looks fine and intact.
  2. MA lines and trend lines are not broken.
  3. MCD and RSI indicator are all in uptrend.


DJIA chart:
 

clip_image008


Input:


  1. DJIA chart is not as healthy as SPY. It is retesting the 20MA line which now act as resistance.
  2. Weekly chart is still intact and healthy. Not a time to get panic yet.


NASDAQ chart:
 

clip_image009


clip_image010


Input:


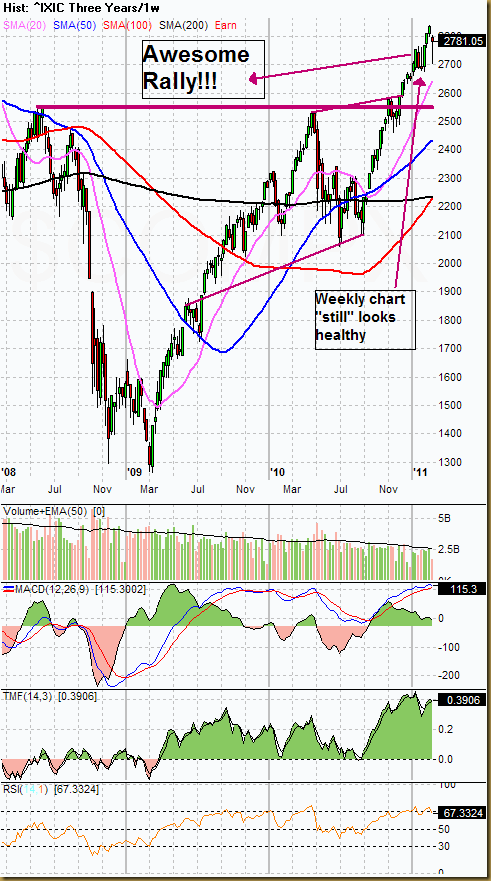
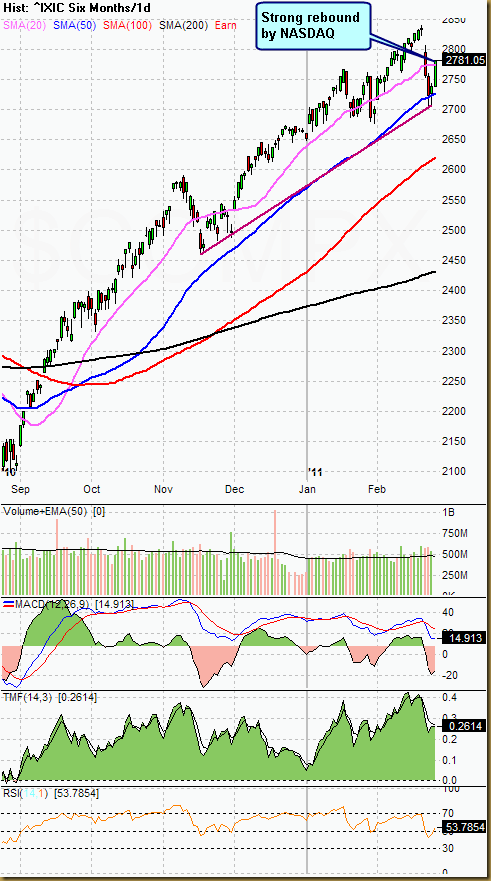
  1. NASDAQ rebound strongly. Good positive sign.
  2. MA lines and trend lines are again intact and healthy both for daily and weekly charts


UUP chart:
 

clip_image011


clip_image012


Input:


  1. The retreat of UUP justify for the rebound of indexes.
  2. However, watch out closely on the point 22.00 at UUP weekly chart. See where it is heading.


Sector Analysis:


clip_image013


Input:


  1. All sectors rebound at 50MA line. A very healthy correction indeed.
  2. XLE goes even higher due to instability of middle east.


GLD, SLV, Natural Gas and UUP charts:
 

clip_image014


Input:


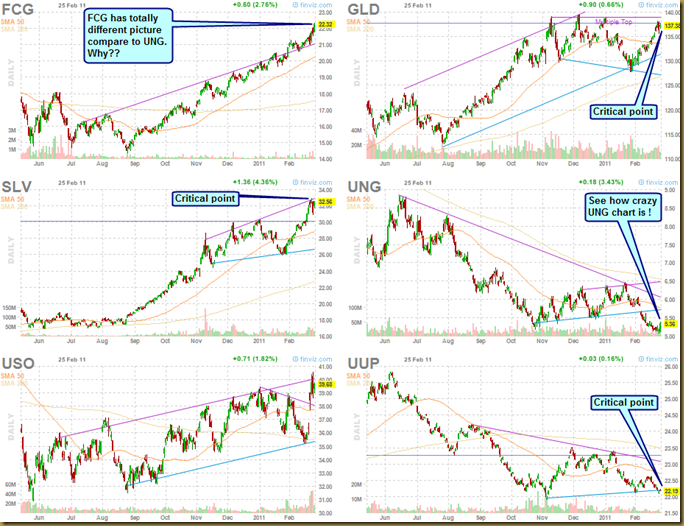
  1. GLD and SLV seems to be at the correction point.
  2. UNG started to rebound.
  3. USO seems to be at correction point as well. Expect middle east problem to get "resolved" soon.


FXI (iShares FTSE / Xinhua China 25 Index Fund) chart:


clip_image015


clip_image016


Input:


  1. Daily FXI chart is still at the down trend channel and still intact.
  2. However, weekly chart indicated that it is at a critical junction. Downward trust seems to be more likely supported by the MACD, TMF, . This can be a threat to the world indexes.


Baltic Dry Index chart:


clip_image017


Input:


  1. No improvement in shipping index.
  2. Don’t go neat the shipping stock yet.

Saturday, October 30, 2010

30th Oct 2010 – My Analysis

BULL or BEAR ??


Short term (1 week)

Long term (6 months)

clip_image001

-- We could be at a turning point. VXX is posing some threat.

-- MACD in daily charts of SPY and DJIA has started to turn negative.

-- The QE2 and interest rate announcement will be the key.

-- Get ready to turn to BEAR when it happens.

clip_image002

-- Will not call off this BEAR before DJIA broke 11,200 point for sure


Next Week Economic Data:


clip_image003


VXX chart:


clip_image004


clip_image005


Input:

  1. Be careful, VXX could be bottom up. It should all depend on the FOMC day on Wednesday.


SPY chart:


clip_image006


clip_image007


clip_image008

Input:

  1. Daily 6 month chart shows that SPY is still intact, but MACD is starting to show bearish sentiment.
  2. Some kind of correction might start. Long term chart shows that price are retreating from the 200MA line.


DJIA chart:


clip_image009


clip_image010


clip_image011

Input:

  1. Same as SPY.
  2. 11K point is a very important support point at 200MA line.
  3. Daily 6 month chart MACD start to turn bearish


NASDAQ chart:


clip_image012


clip_image013


clip_image014


Input:

  1. NASDAQ is still very strong and it still has room to grow.


Sector Analysis:


clip_image015


Input:

  1. XLK is still very bullish. That explain why NASDAQ still not stopping.


GLD, SLV and UUP charts:


clip_image016


Input:

  1. UNG is quite interesting, looks like already bottom.
  2. UUP is fluctuating quite heavily at bottom. Could be in progress of deciding bottom.
  3. USO continue to be block by the trendline.

Friday, October 22, 2010

22nd Oct 2010 – Warren Buffett said BUY…

You just have to listen to this guy. He said sell, that thing will sure go down.

temp2

GLD - Candle One Year_1d #D#

Thursday, October 7, 2010

Wednesday, September 22, 2010