Thursday, January 20, 2011

20th Jan 2011 – Special Review on Thaipusam

temp2

clip_image001


  1. Interest rate announcement on 26th Jan and GDP on 28th Jan.
  2. NASDAQ and SP500 was trashed by > 1%, but DJIA doesn't even move. Interesting!!!


SPY chart:


clip_image002


clip_image003


Input:


  1. Don’t think we can call the start of bear market yet. Trend line is still intact.


DJIA chart:


clip_image004


Input:


  1. DJIA doesn't seem to care what happened to SP500 and NASDAQ


NASDAQ chart:


clip_image005


clip_image006


Input:


  1. Daily chart looks ugly but the trend line is still intact.

20th Jan 2011 – You (America and England) owe me $45K

temp2

temp

20th Jan 2011 – AAPL i-Sick

temp

AAPL - Candle All_60m 2011-01-20

Interesting!!!

20th Jan 2011 – Can someone explain this?!

I don’t get this, what is going on with the stock market? Dow was not moving while Nasdaq and SP500 were trashed. I have never seen this before!

temp

Wednesday, January 19, 2011

19th Jan 2011 – Pattern Study - SOLF

Ticker:


  1. SOLF


Topic:


  1. My good friend (Fang) spotted this stock.


Lesson Learnt:


  1. The daily chart clearly shows how insider letting go SOLF one month before the quarter result announcement. It shows how the stock gap down after touching the trend line.
  2. Multi-bottom was formed  with low volume and then gap up with good volume  to the trend line which generate a strong buy signal.
  3. It then retraced back to the 50MA line for a healthy consolidation and then rally again.
  4. This stock is still in the 1st phase of rally. Good for LONG entry.
  5. RSI and MACD both go above the zero line.


Intraday Chart

-NA-


Historical Chart


    clip_image001


    clip_image002

19th Jan 2011 – World bubble for 2011

temp

temp2

temp3

19th Jan 2011 – It is just a matter of time!

It is just a matter of time that Renminbi will replace USD!

renmimbi

temp

19th Jan 2011 – Pattern Study - IBCP

Ticker:


  1. IBCP


Topic:


  1. My very good friend (KF) has just introduced me a real crazy but fantastic stock, IBCP.
  2. He should have told me earlier like one week ago.    *sigh*


Lesson Learnt:


  1. This one can be much more profitable than Citibank. It falls from $285.00 all the way down to $1.00.
  2. You can actually short this stock for 5 years if you do short it at the very top.
  3. Got to find a way to get into this stock.
  4. I have to find a way to search for this kind of stock in Quote Tracker.


Intraday Chart

clip_image001


Historical Chart

clip_image002


clip_image003

Monday, January 17, 2011

17th Jan 2011 – My Analysis

BULL or BEAR ??


Short term (1 week)

Long term (6 months)

clip_image001

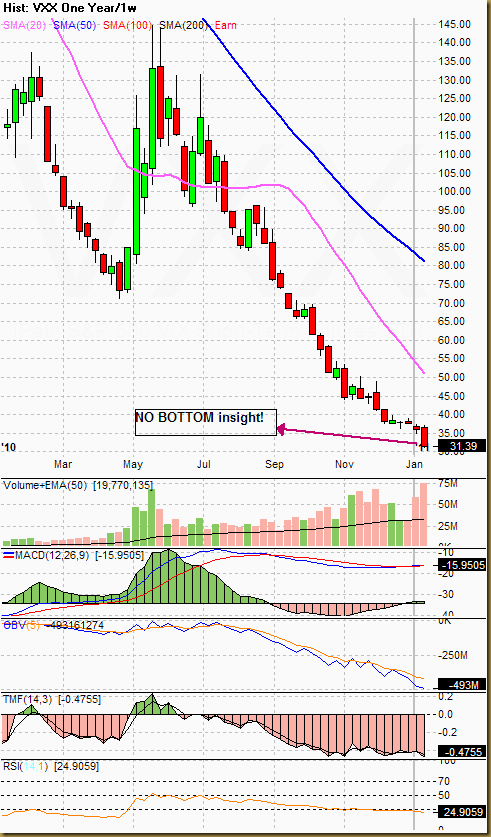
-- Volatility shows no bottom in sight at all.

-- Indexes tends to recover back when bad news came out and rally whenever there is any slight good or ok news.

-- Bank stocks rally like crazy.

-- The only worry now is that GLD has started its downtrend which might bring UUP to uptrend and that might pause the stock market. Let's see!

clip_image001

-- SUPERBULLS.

-- Big resistance broken again, now become support.

-- ALL ETFs are strong, Financial and Industrial ETF are extremely bullish. Totally no weakness in sight.


Next Week Economic Data:


clip_image002


Input:


  1. Not much volatility except Thursday.
  2. Remember, the trend now is bad news is consider as good news also.


VXX chart:
 

clip_image003


Input:


  1. VXX chart basically has NO BOTTOM insight.
  2. Don't touch the short side. It is just too damn dangerous.


SPY chart:
 

clip_image004


Input:


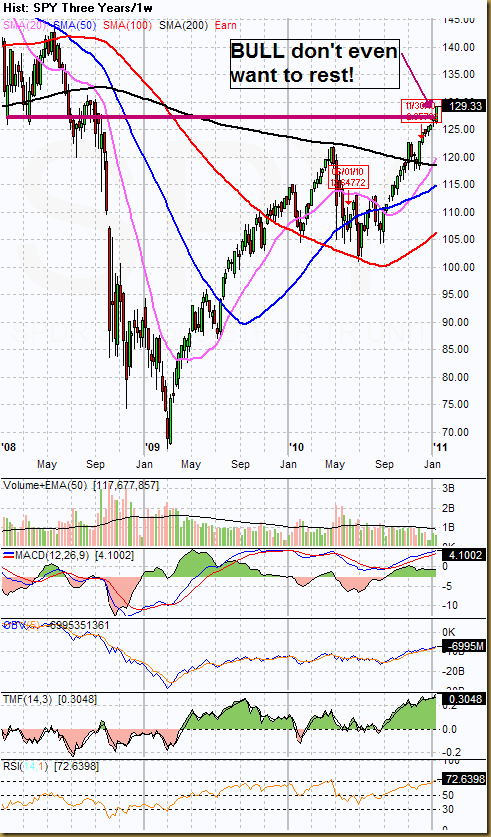
  1. We are in some kind of SUPER BULL stage.
  2. No matter what news is out on CNBC, Bull take charge.


DJIA chart:
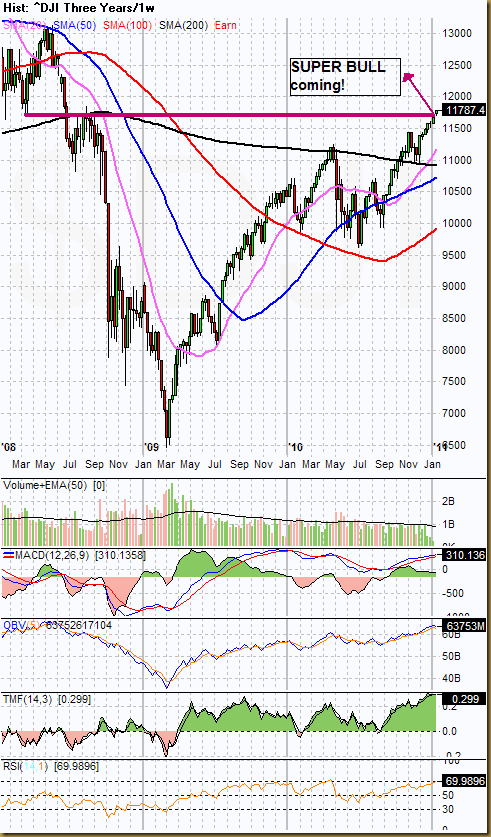
 

clip_image005


Input:


  1. Same, resistance line broken.


NASDAQ chart:
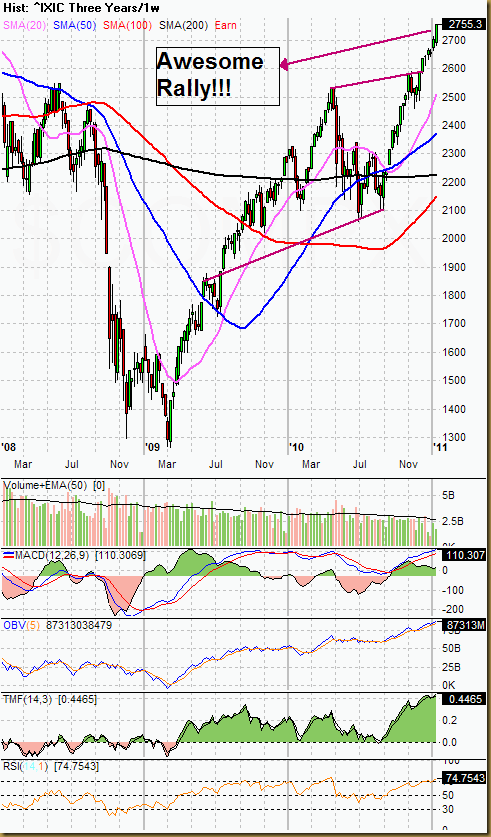
 

clip_image006


Input:


  1. Same, resistance line broken.


UUP chart:
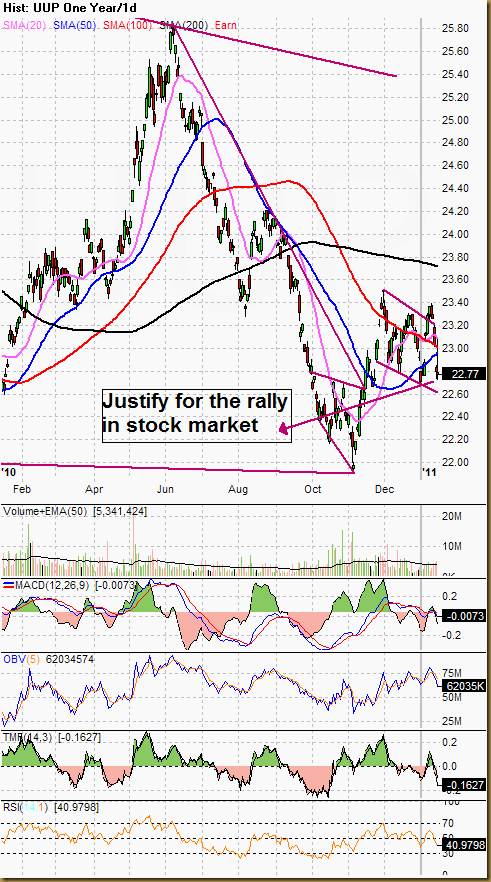
 

clip_image007


Input:


  1. Look at how the UUP was trashed and compare to how the stock market rally.
  2. Strongly believe that UUP and stock market are still reversely related.
  3. Watch closely how UUP play out at the lower trend line.
  4. Watch carefully how the downtrend of GLD is going to affect this UUP trend.


Sector Analysis:
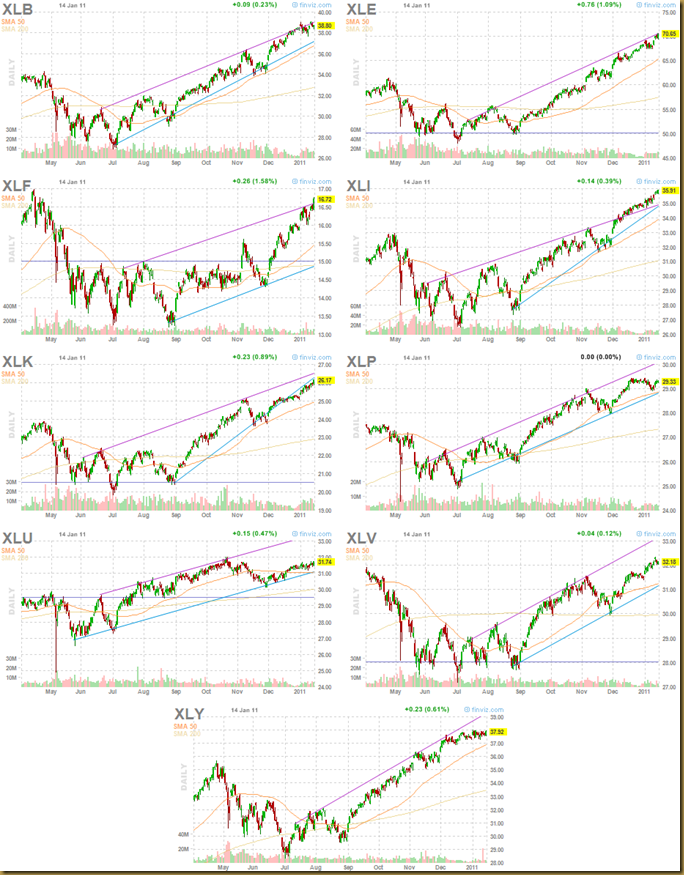
 

clip_image008


Input:


  1. NO weakness shown at all in all ETF. What a bull market.
  2. Financial and Industrial sectors are really outperforming.


GLD, SLV and Natural Gas charts:


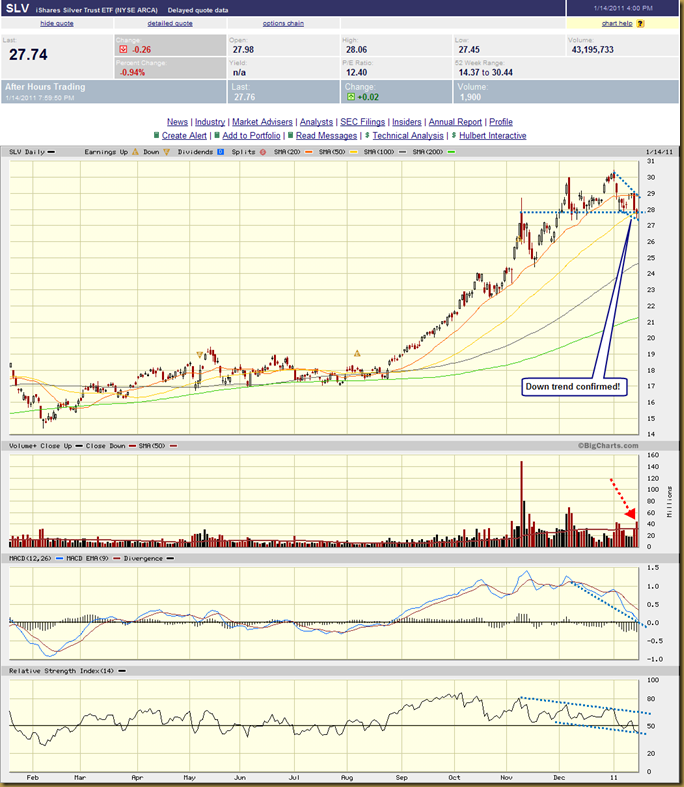
clip_image009


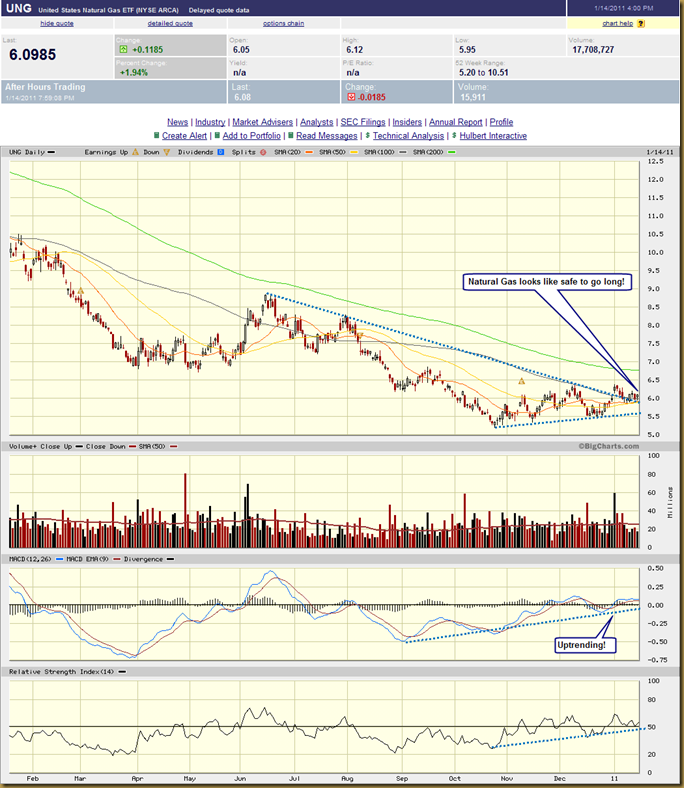
clip_image010


clip_image011

Input:


  1. GLD is behaving exactly like what I have expected even though I have no $$ to short it. Downtrend is confirmed.
  2. This means that UUP weakness could be short term. Be careful!
  3. SLV also topped up. MACE and RSI added confirmation on this.
  4. Natural Gas looks safe for LONG entry, if and only if I got $$$. It has broken the trend line and that line is now acting as support.


FXI (iShares FTSE / Xinhua China 25 Index Fund) chart:
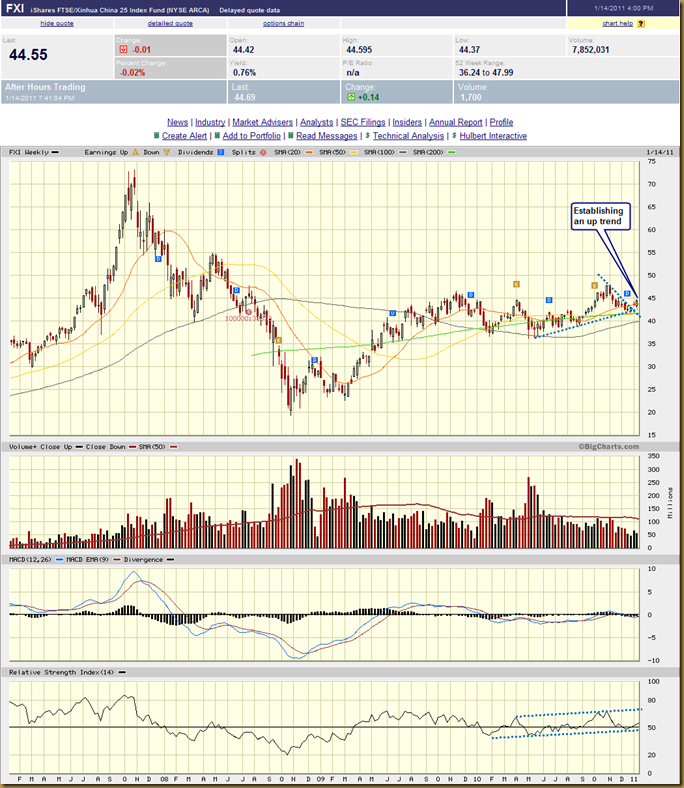
 

clip_image012


Input:


  1. China is back in up trend again.


Baltic Dry Index chart:


clip_image013


Input:


  1. No sign of recovery in shipment Baltic Dry Index.
  2. It reflect clearly in all the shipment stock like FREE, SHIP, EGLE, OCNF….

Thursday, January 13, 2011

13th Jan 2011 – Pattern Study -- Want to see how Island Reversal works out?

Ticker:


  1. AMD and CROX


Topic:


  1. Want to see how Island Reversal works out?


Lesson Learnt:


  1. Happen to be the same kind of reason for the island reversal pattern -- Somebody in VP level are leaving the company.
  2. Looks like it is quite profitable if you can spot this pattern on the day it happen. I actually saw it happen on CROX, but no action taken.       ;-)
  3. For these two stocks, shorting CROX might be much safer compare to shorting AMD.  AMD has got a strong support line at $8.20 where is previously gap up. CROX's 20MA line now act as resistance instead of support and should help to push the stock down.


Intraday Chart

clip_image001


clip_image002


clip_image003


clip_image004


Historical Chart

clip_image005


clip_image006