Friday, March 18, 2011

18th March 2011–Pattern Study–HOt doGS

Ticker:


  1. HOGS


Topic:


  1. The power of Island Isolation.
  2. HOGS produced Hot Dogs and itself now looks like HOt doGS too.


Lesson Learnt:


  1. Indicator after indicator keep telling you to SELL or SHORT.
  2. Island Isolation came first.
  3. Then break 20MA, 50MA, 100MA and 200MA lines.


Intraday Chart

clip_image001


clip_image002


Historical Chart

clip_image003

Thursday, March 17, 2011

17th March 2011–Pattern Study–BAC

Ticker:


  1. BAC


Topic:


  1. Drop down from Triangle Formation


Lesson Learnt:


  1. When C is not doing well, BAC will not do well too.
  2. BAC broke the triangle and fall.
  3. BAC broke down the 20MA and 50MA lines.


Intraday Chart

clip_image001


Historical Chart

clip_image002

17th March 2011–Pattern Study - C

Ticker:


  1. C


Topic:


  1. A big mountain burden for C


Lesson Learnt:


  1. Break the up trend line, break the support line.
  2. Break the 20MA, 50MA and 100MA lines.
  3. Approaching the 200MA line. $4.30 will be a good entry point.


Intraday Chart

clip_image001


Historical Chart

clip_image002

Wednesday, March 16, 2011

16th March 2011–Pattern Study–AAPL

Ticker:


  1. AAPL


Topic:


  1. A possible Head-n-Shoulder formation??!!


Lesson Learnt:


  1. Is this the right time to short AAPL? Or should I wait for my Long entry?
  2. It just release iPad 2 and it is hot in the market.
  3. Shorting this kind of strong stock needs a lot of guts and patient.


Intraday Chart

clip_image001


Historical Chart

clip_image002

16th March 2011–Pattern Study - EWJ

Ticker:


  1. EWJ -- Japan Index


Topic:


  1. Multiple bottom formation.
  2. Under ocean earth quake.
  3. Tsunami destroyed Japan city.
  4. Japan index fall more than 14% at one point.


Lesson Learnt:


  1. Opportunity comes when bloods flow on the street.


Intraday Chart

clip_image001


Historical Chart

clip_image002


clip_image003

Tuesday, March 15, 2011

15th March 2011–Pattern Study–CROX

Ticker:


  1. CROX


Topic:


  1. Twin Tower formation for CROX


Lesson Learnt:


  1. An interesting twin tower formation that I have not observed before.
  2. I believe if the upward breakout happen for the third time, it should be strong and bullish.


Intraday Chart

-NA-


Historical Chart

clip_image001


clip_image002

Monday, March 14, 2011

14th March 2011–My Analysis

BULL or BEAR ??


Short term (1 week)

Long term (1 month)

clip_image001

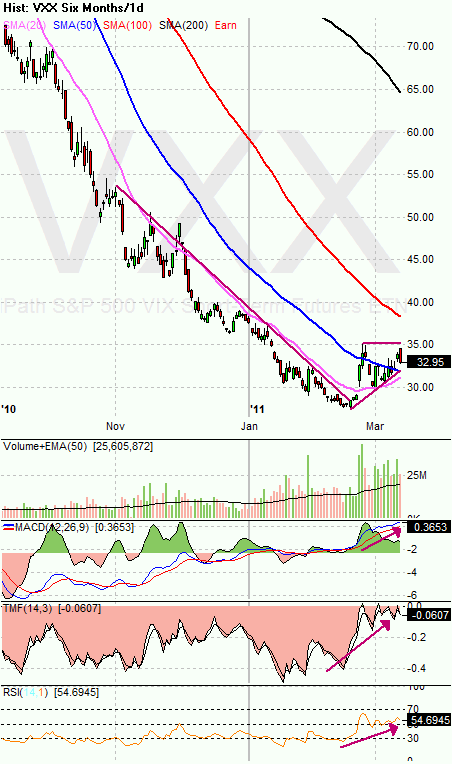
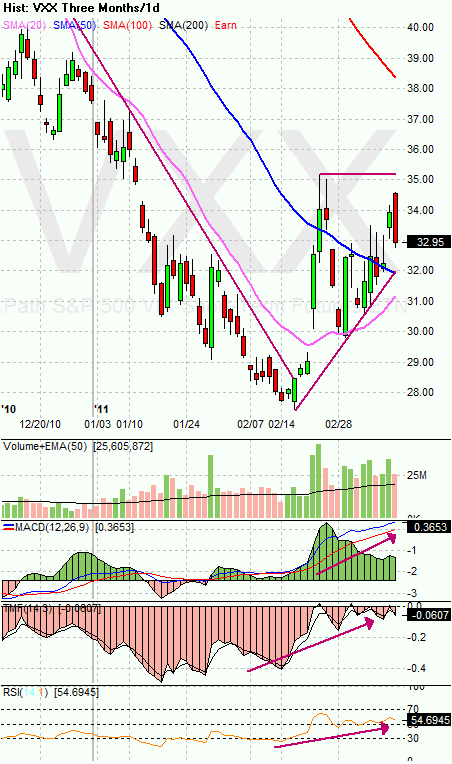
-- VXX chart is quite bullish. 3 up bars in consequence 3 weeks.

-- It has been staying above the 20MA and 50MA lines.

-- FOMC meeting coming on Tuesday, more data in the pipeline too, more volatility expected.

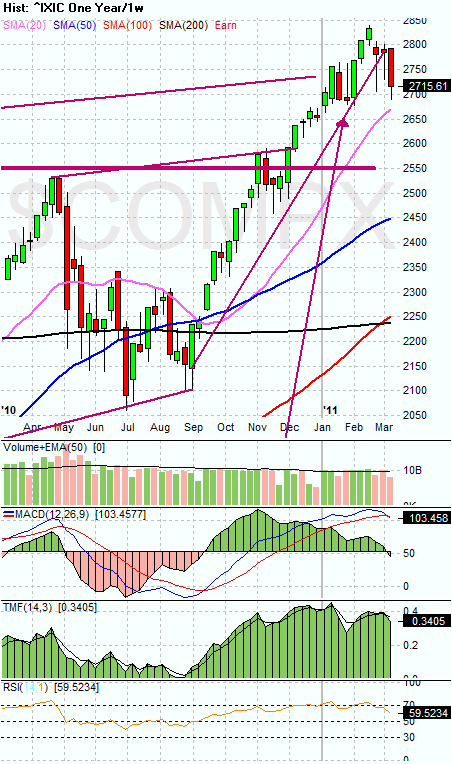
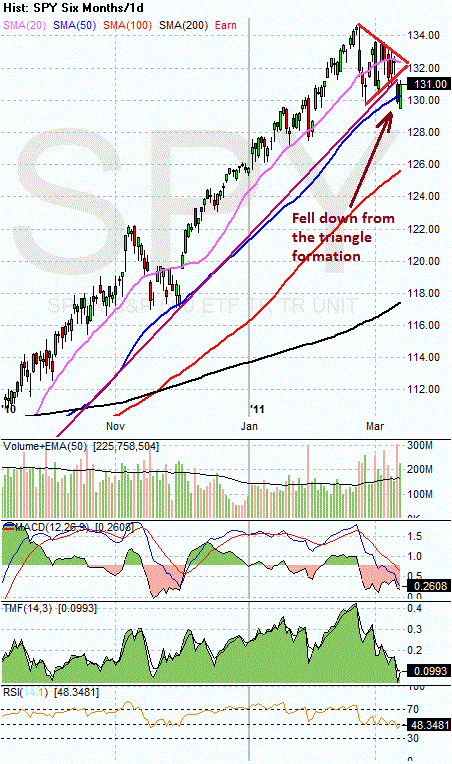
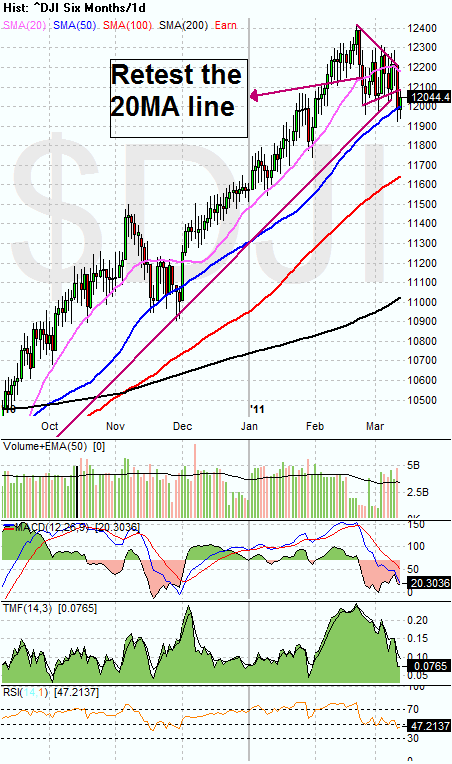
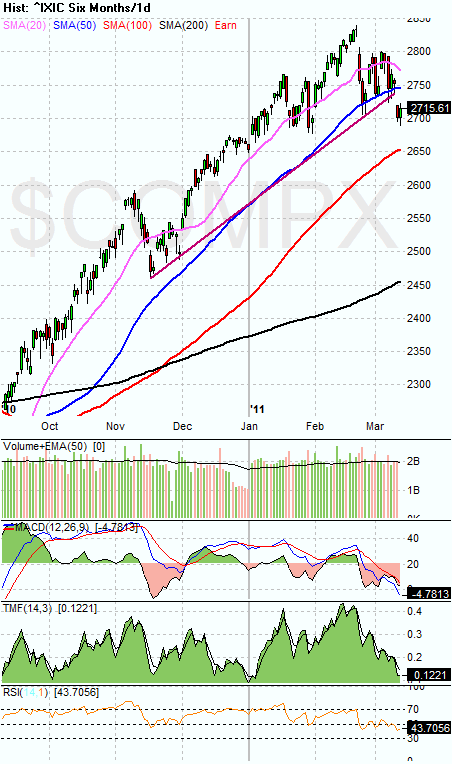
-- All 3 major indexes have broke their uptrend formation and is basically below their 20MA lines.

-- Many sector ETFs have started to break their uptrend.

clip_image001[1]

-- Unrest in Libya and middle east.

-- Disaster in Japan.

-- The only thing that can help the bull is the Dollar and FXI.


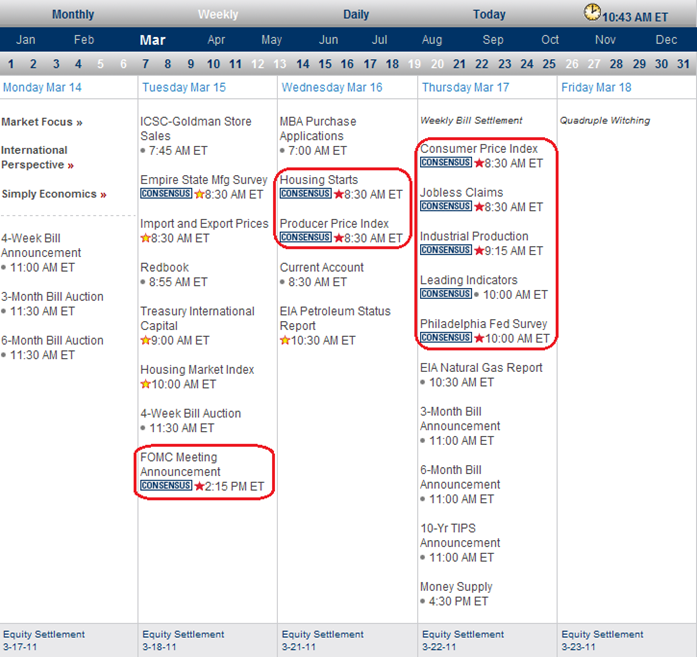
Next Week Economic Data:


clip_image002


Input:


  1. FOMC announcement on Tuesday.
  2. Some heavy data out on Wed and Thursday.
  3. All these could add on the volatility from last week.


VXX chart:
 

clip_image003


clip_image004


clip_image005


Input:


  1. VXX has shown green bar for 3 straight weeks. This is not good for the bull.
  2. Overall it is showing a bull formation which means Bear for the stock market.
  3. All indicators are pointing upwards.


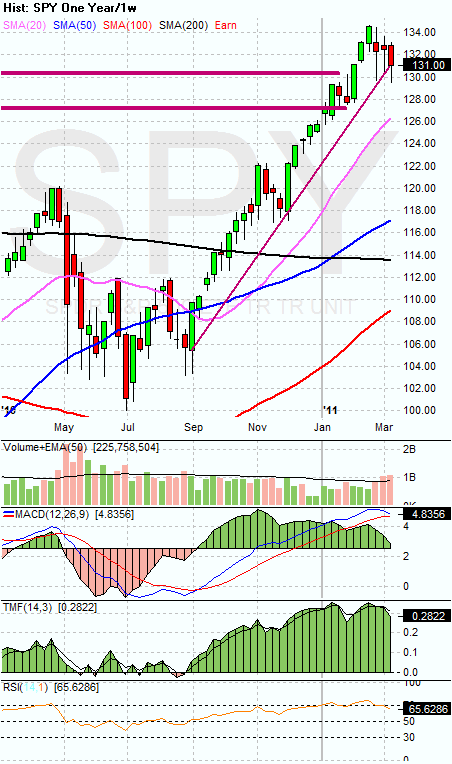
SPY chart:
 

clip_image006


clip_image007


Input:


  1. Daily chart still show weakness. Below trend line and below 20MA line. However, it did break upward througt 50MA line again.
  2. Weekly chart shows that it is still in tact.


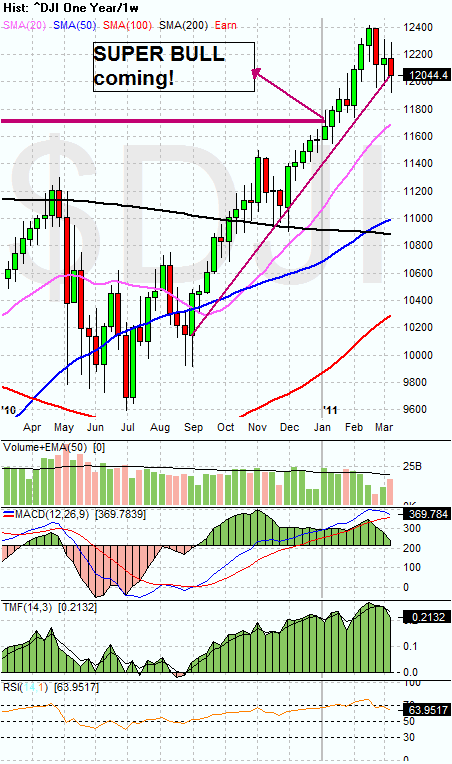
DJIA chart:
 

clip_image008


clip_image009


Input:


  1. Similarly, daily chart looks weak. Weekly chart still intact.


NASDAQ chart:
 

clip_image010


clip_image011


Input:


  1. Both daily and weekly charts are "out of shape".


UUP chart:
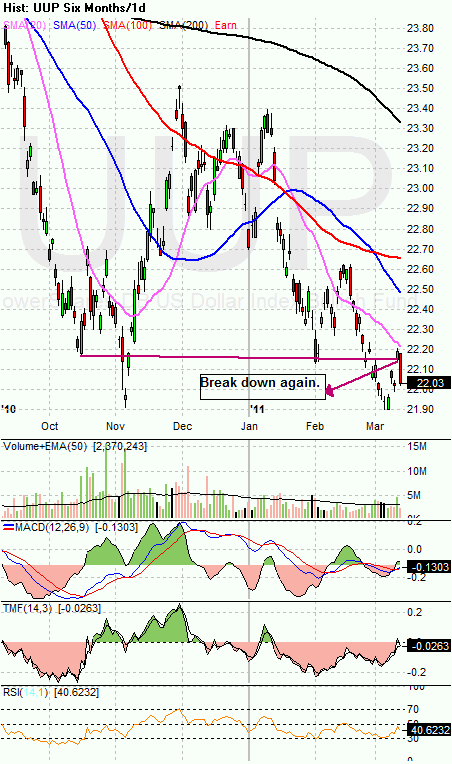
 

clip_image012


clip_image013


Input:


  1. Daily chart shows that Dollar is weak. This might help the bull in the market.
  2. Weekly chart shows that it might have broken the multiple bottom formation. Now it is retesting the multiple bottom line. If it fails, there will be more down turn for Dollar.


Sector Analysis:
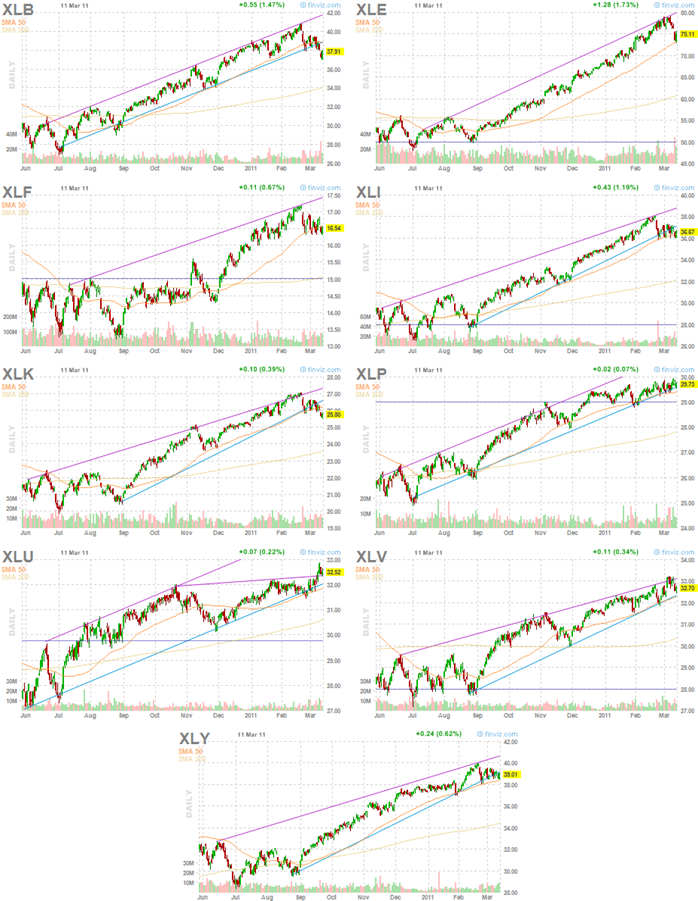
 

clip_image014


Input:


  1. Some sectors starting to brake their uptrend.
  2. Only utility is showing strength. Isn't this a Bear pattern?


GLD, SLV, Petrol and Natural Gas charts:
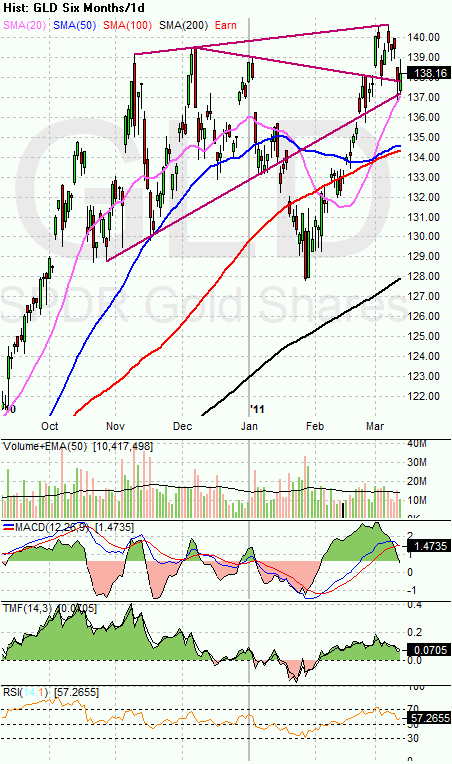
 

clip_image015


clip_image016


clip_image017


clip_image018


clip_image019


clip_image020

Input:


  1. GLD is still in strong bull mode.
  2. SLV is a crazy Bull.
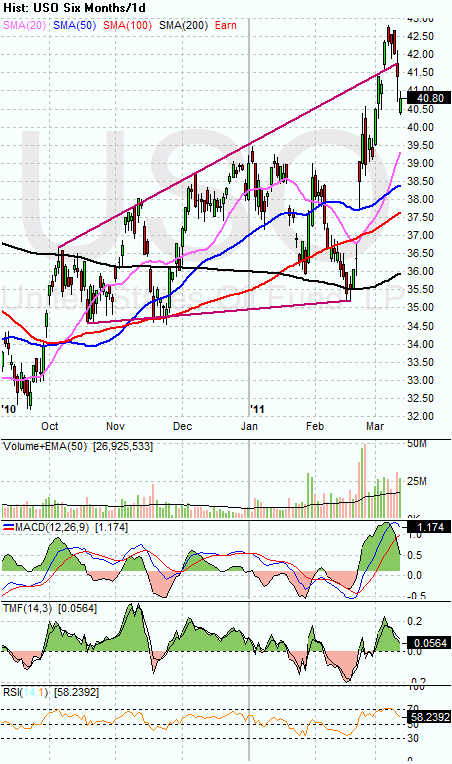
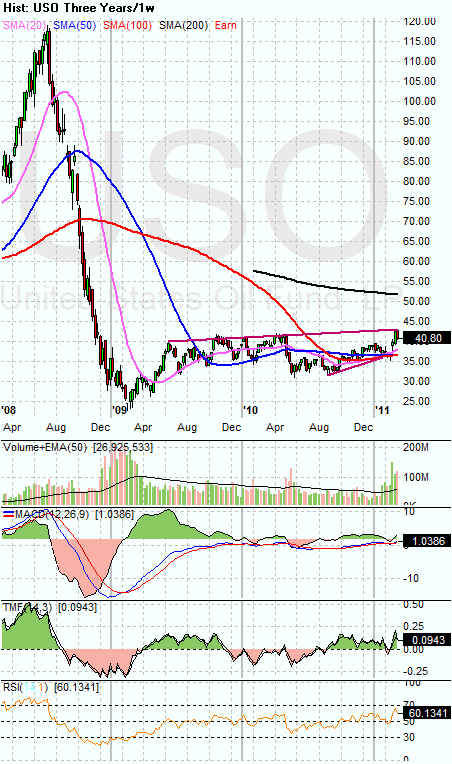
  3. USO is in correction mode but it is expected by looking at the weekly chart. Overall it is still in bull mode.
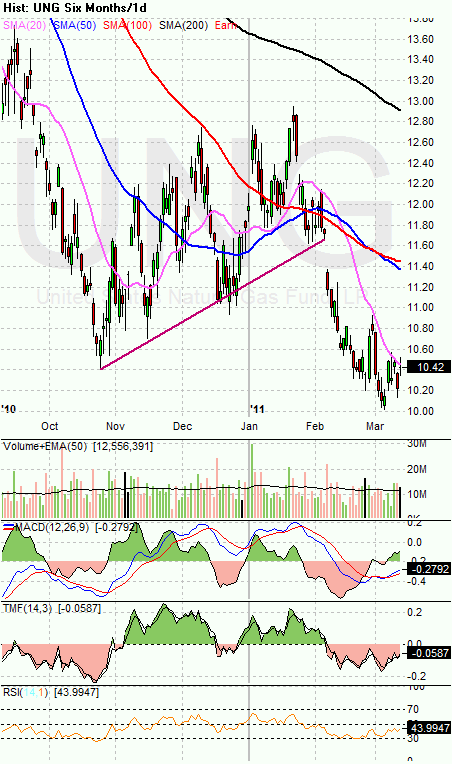
  4. Natural gas is still in Bearish mode.


FXI (iShares FTSE / Xinhua China 25 Index Fund) chart:
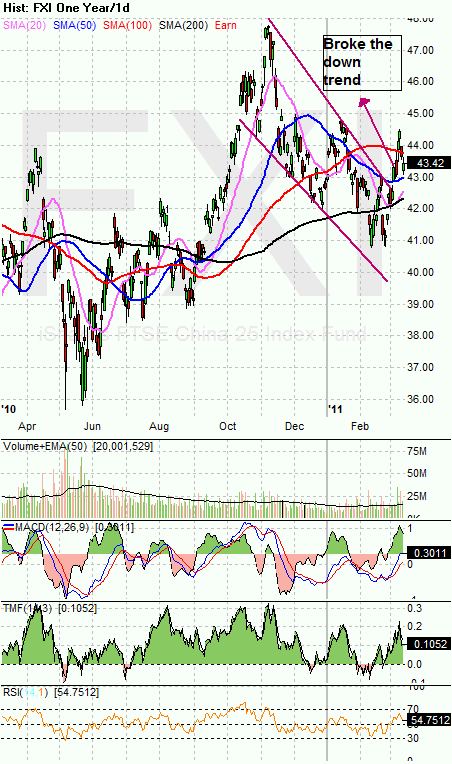
 

clip_image021


clip_image022


Input:


  1. FXI broke the down trend and now testing its 20MA line resistance.
  2. Will this indicate a bull in US market?


Baltic Dry Index chart:
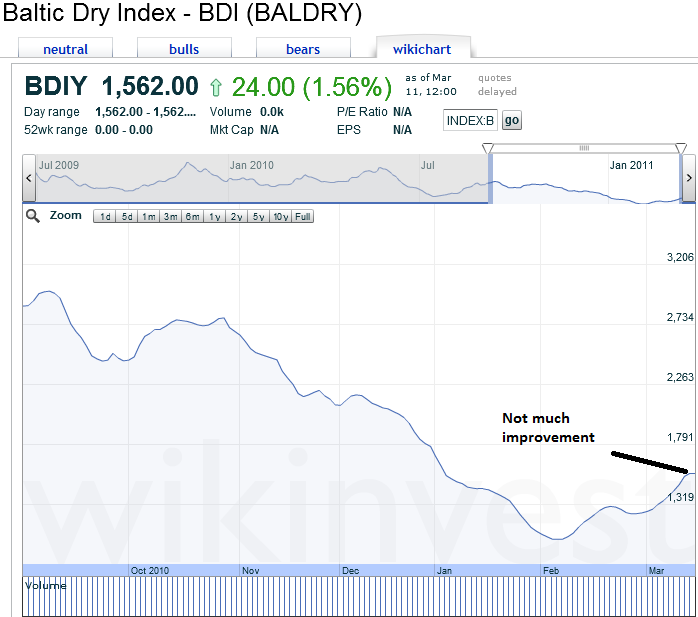
 

clip_image023


Input:


  1. Definitely not something that you want to go near to.

Friday, March 4, 2011

4th March 2011 – Pattern Study – Can you take the HEAT?

Ticker:


  1. HEAT


Topic:


  1. Can you take the HEAT


Lesson Learnt:


  1. Long Wide double bottom pattern. Definitely delicious, but is it poisonous?


Intraday Chart

-NA-

Historical Chart

clip_image001


clip_image002

4th March 2011 – Pattern Study –Take a guess… BEAR or BULL?

  1. Standing on the fence and keep watching.


Lesson Learnt:


  1. Is this a BEAR (punch thru trend line downward) or a BULL (50MA line) case??
  2. Watch carefully.


Intraday Chart

clip_image001

Historical Chart

clip_image002

Thursday, March 3, 2011

3rd March 2011 – Another stop loss triggered SPMD

Buy $

Sell $

Sell Short $

Buy Back $

Stop Loss $

Profit / Losses

Duration


7.60


7.60

    Angry

2 weeks


Reason for Buy / Sell / Sell Short / Buy Back:


  1. Stop loss triggered.


Lesson Learnt:


  1. Stop loss saves life. Obey it… obey it.
  2. I could have move the stop up when I was in slight positive few days back. I could have come out even.
  3. Pay close attention to this one and see when it start to turn back.


Intraday Chart

clip_image001


Historical Chart

clip_image002


clip_image003