Wednesday, February 16, 2011

16th Feb 2011 - SPMD

Buy $

Sell $

Sell Short $

Buy Back $

Stop Loss $

Profit / Losses

Duration

8.30


7.60


Reason for Buy / Sell / Sell Short / Buy Back:


  1. Coming up from a flag formation in weekly chart.
  2. It has completed the 76.4% Fibonacci retracement.
  3. Quarter Report on 23rd Feb -- Quite dangerous.


Lesson Learnt:


  1. Intraday looks good for entry.


Intraday Chart

clip_image001


Historical Chart

clip_image002


clip_image003


clip_image004

16th Feb 2011 – Pattern Study - DPS

Ticker:


  1. DPS


Topic:


  1. Bitter Dr. Pepper
  2. Another Head-n-Shoulder formation.


Lesson Learnt:


  1. You just have to learn this pattern well.
  2. Sometimes it just take such a long time to form completely.


Intraday Chart

clip_image001


Historical Chart

clip_image002


clip_image003


Tuesday, February 15, 2011

15th Feb 2011 – When you are BORN unlucky !

Buy $

Sell $

Sell Short $

Buy Back $

Stop Loss $

Profit / Losses

Duration


12.55


    Crying

3 Weeks


Reason for Buy / Sell / Sell Short / Buy Back:


  1. Market rallied but BORN is not.
  2. Small profit has turned into losses.
  3. Intraday still look weak.


Lesson Learnt:


  1. Daily chart has actually showed that I should wait for the price to come to the trend line for my entry.
  2. I should have move my stop loss up sooner.
  3. Decide to take the losses earlier.


Intraday Chart

clip_image001


Historical Chart

clip_image002

15th Feb 2011 – Cannot get GROUPON, get DANG DANG

Buy $

Sell $

Sell Short $

Buy Back $

Stop Loss $

Profit / Losses

Duration

26.00


Reason for Buy / Sell / Sell Short / Buy Back:


  1. It reached the best retracement level of Fibonnaci 76.4%.
  2. It has also touched down the previous low/bottom.
  3. It has broke up through the down trend line and start to show sign of life.
  4. Intraday shows very good setup for entry.
  5. This business looks similar to GROUPON!


Lesson Learnt:


  1. Was watching it since last month and decide to see how it react to the 20MA line first before my entry.
  2. Looks like my patient and monitoring skill will yield reward.


Intraday Chart

clip_image001


Historical Chart

clip_image002


clip_image003

15th Feb 2011 – Pattern Study - WFC

Ticker:


  1. WFC


Topic:


  1. Cup with Handle  --- OR --- Triangle Ascending ?


Lesson Learnt:


  1. Prefer to look at it as Cup with Handle pattern.
  2. Should I follow Buffett?
  3. Why he sells BAC?


Intraday Chart

-NA-

Historical Chart

clip_image001


clip_image002


clip_image003


clip_image004

15th Feb 2011 – Pattern Study - HAWK

Ticker:


  1. HAWK


Topic:


  1. Black Hawk DOWN !
  2. When one of the BEST multiple bottom chart pattern FAILED !


Lesson Learnt:


  1. Things can go real bad even for the best technician/trader.
  2. Fundamental of the company still has the final say.


Intraday Chart

-NA-

Historical Chart

clip_image001


clip_image002

Monday, February 14, 2011

14th Feb 2011 – Pattern Study – CKEC (coming to the theater near you !)

Ticker:


  1. CKEC


Topic:


  1. Triangle Setup


Lesson Learnt:


  1. Looks profitable for LONG entry.


Intraday Chart

clip_image001


Historical Chart

clip_image002

Sunday, February 13, 2011

13th Feb 2011 – My Analysis

BULL or BEAR ??


Short term (1 week)

Long term (6 months)

clip_image001

-- There is basically "nothing" that comes to stop the rally.

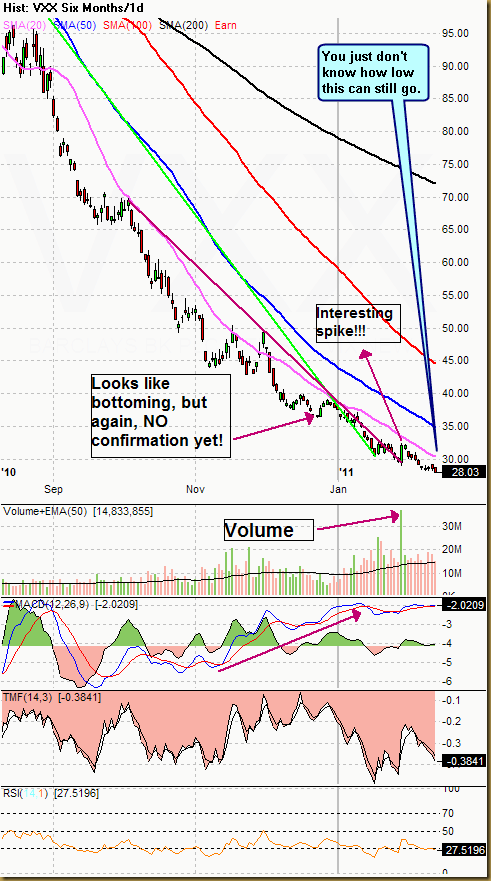
-- VXX has no sign of bottom yet.

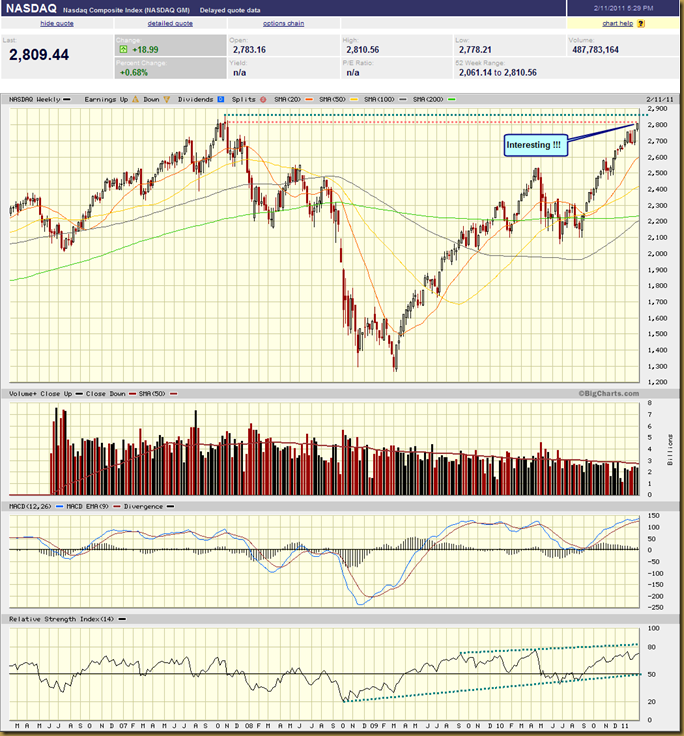
-- Watch out for all time high NASDAQ.

-- SPY could be in progress of forming a head-n-shoulder if you look at it from helicopter point of view, but even that, it has a long way to go up before the right shoulder is formed.

-- UUP still has some time before it comes to form a multiple bottom.

-- Many sectors have poke through its uptrend line upward.

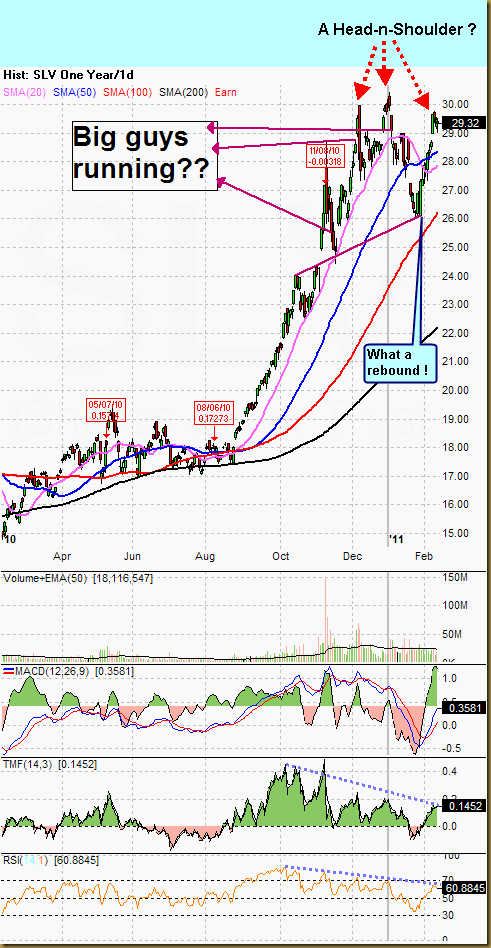
-- GLD still embarked on its downtrend while SLV could follow with a possible head-n-shoulder formation.

-- FXI is somehow at a critical junction. Friday's USA rally should help to rally FXI market.

-- Murbarak from Egypt stepping down.

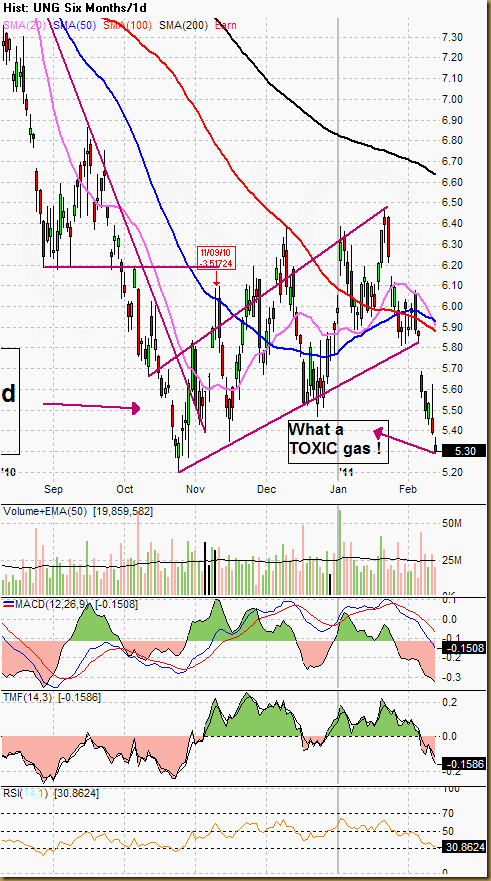
-- UNG is the weird one. What a toxic gas.

clip_image002

-- From now on, I think I will this column blank.

-- So far, I don’t think this column helps me. It does not do any harm, but…..


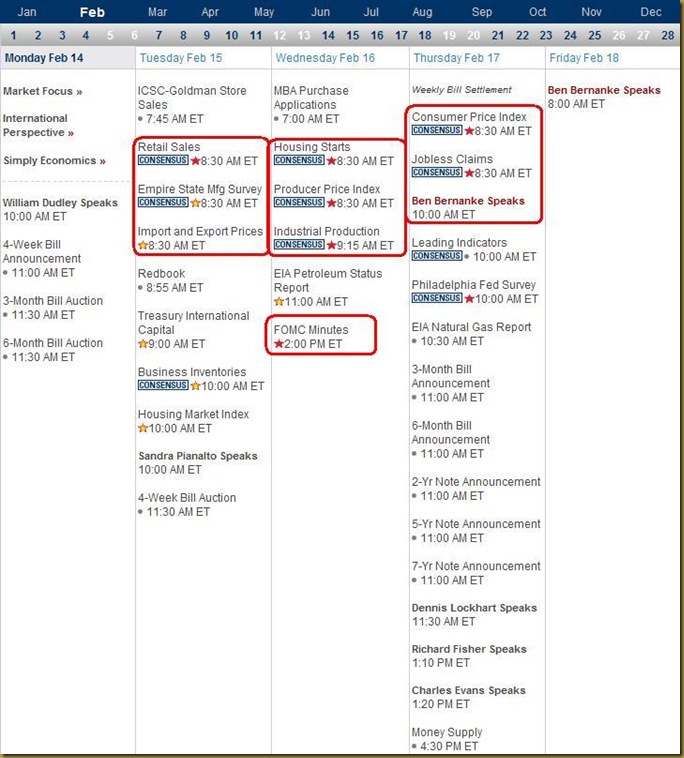
Next Week Economic Data:


clip_image003


Input:


  1. A bit of important data coming out. Expect a bit of volatility in the middle of week.


VXX chart:
 

clip_image004


Input:


  1. The VXX chart looks really crazy, but you just have to accept it. You have no idea how low can it still go.


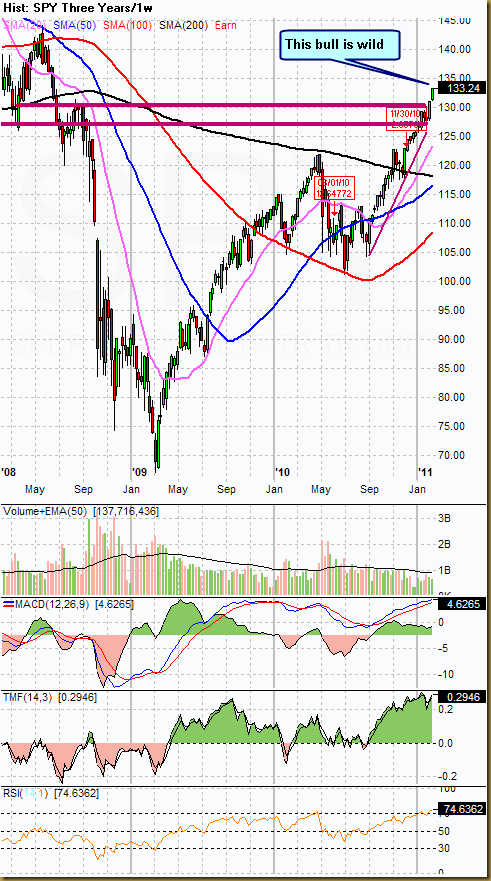
SPY chart:


clip_image005


clip_image006


clip_image007


Input:


  1. What a BULL market.


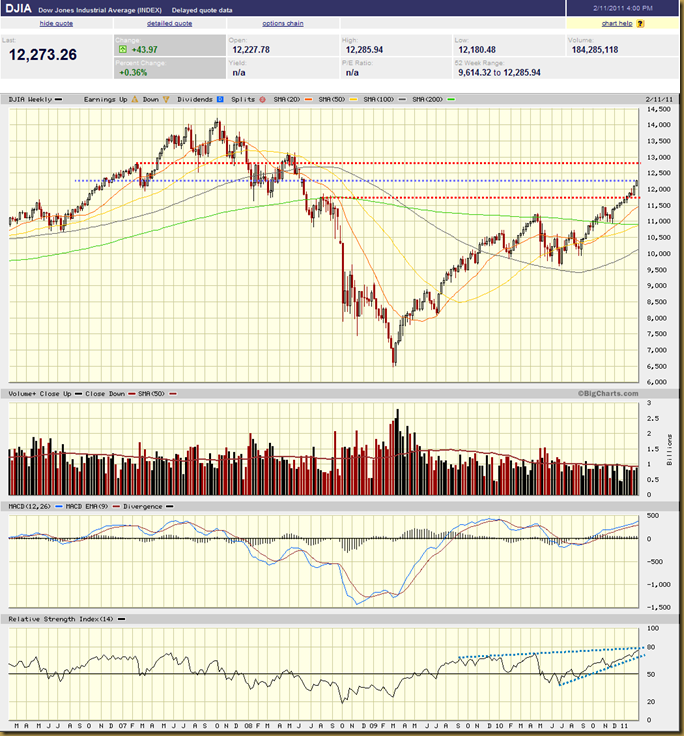
DJIA chart:


clip_image008


Input:


  1. Very Bullish.


NASDAQ chart:


clip_image009


Input:


  1. NASDAQ is hitting an all time high. What is it going to bring us to?


UUP chart:
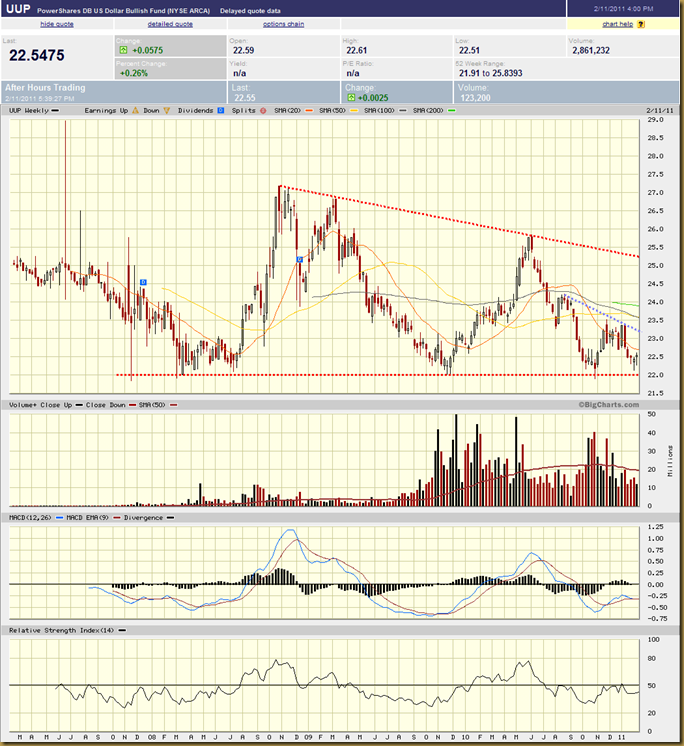
 

clip_image010


Input:


  1. UUP down trend is still intact. Watch out for multiple bottom formation.


Sector Analysis:
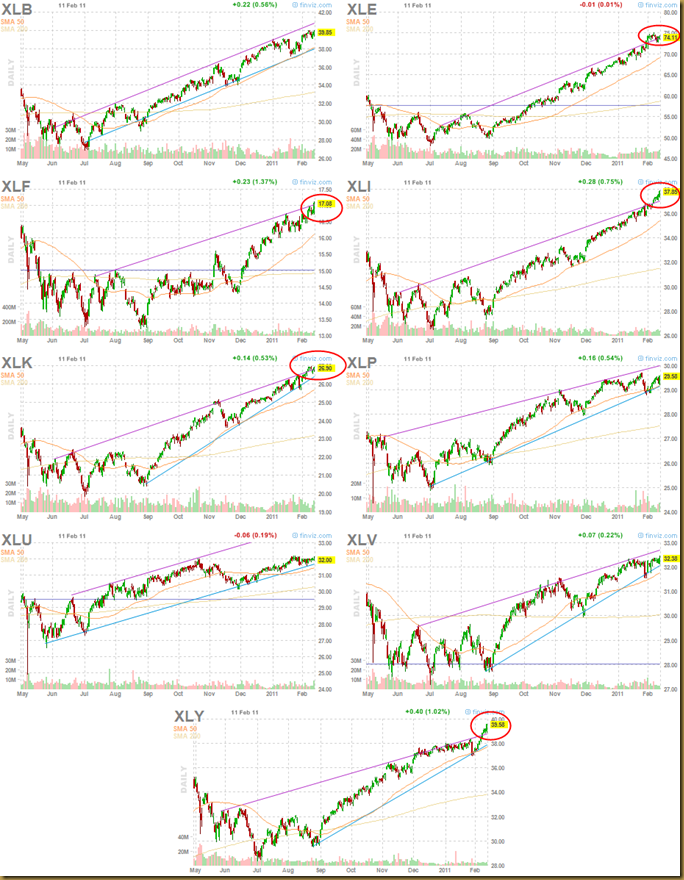
 

clip_image011


Input:


  1. Many sectors have gone beyond its uptrend line.


GLD, SLV and Natural Gas charts:
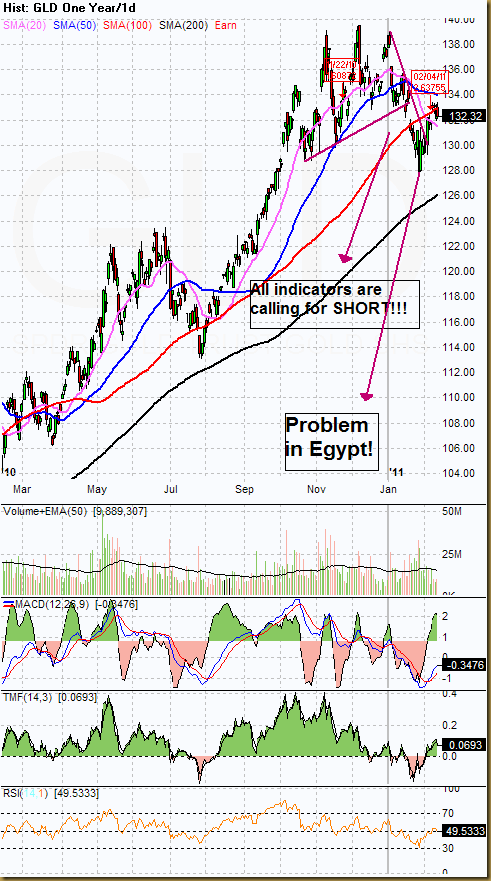
 

clip_image012


clip_image013


clip_image014


Input:


  1. GLD's rebound is not as hard as SLV.
  2. GLD has not overcome its Head-n-Shoulder downtrend yet.
  3. SLV looks like forming a Head-n-Shoulder pattern.
  4. SLV is one step slower than GLD, so if GLD had completed a Head-n-Shoulder, SLV should be taking the similar step.
  5. UNG -- What a TOXIC gas. Coming for a double bottom. Read this article from FORTUNE http://money.cnn.com/2011/02/11/news/economy/chesapeake-natural-gas-shakeout.fortune/index.htm


FXI (iShares FTSE / Xinhua China 25 Index Fund) chart:
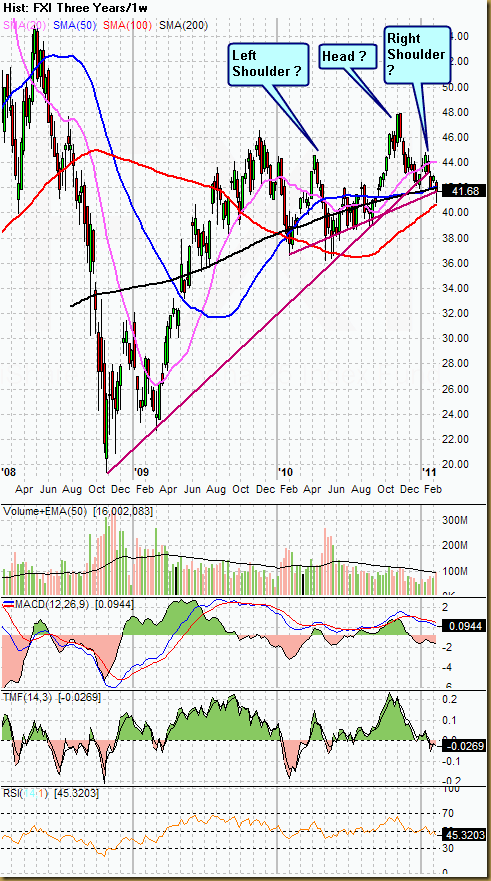
 

clip_image015


Input:


  1. FXI looks like still in down trend.
  2. Is it in a Head-n-Shoulder pattern?


Baltic Dry Index chart:


-NA-


Input:


  1. -NA-

Friday, February 11, 2011

11th Feb 2011 – Pattern Study - AKAM

Ticker:


  1. AKAM


Topic:


  1. Perfect Head-n-Shoulder


Lesson Learnt:


  1. Try not to go long at this kind of head-n-shoulder formation especially when it is due for quarterly report. The reason that the head-n-shoulder has formed is basically telling you that the institution who has got information already letting go this stock.


Intraday Chart

-NA-


Historical Chart

clip_image001

11th Feb 2011 – Pattern Study – Have you driven a Ford lately?

Ticker:


  1. F


Topic:


  1. Double Top


Lesson Learnt:


  1. Quarterly report out, trend line broken and double top formation confirmed --- You just have to let it go.
  2. Will there be the next shorting point as shown in the chart?


Intraday Chart

clip_image001


Historical Chart

clip_image002