BULL or BEAR ??
| Short term (1 week) | Long term (1 month) |
| 
-- VXX is showing sign of life. Daily chart looks like bottom is set in. -- UUP is bouncing from its bottom of $21.00 and going to retest its downtrend line. -- Many data are lining up for the entire week. -- Quadruple Witching on Friday. -- Many sectors are very weak especially XLF, even though few sectors might have a temporary technical rebound. | ![clip_image001[1]](https://blogger.googleusercontent.com/img/b/R29vZ2xl/AVvXsEjfpEMsPpSO1P2jUOgsb40s9OUnb5WdBkFEWpELbZ1NVKQN87HCvoeUkvqYmIZaiIoO0F1TU3Ql4SuONu7lS24iuHAlL6S4BNGcS4jMXTtigiBIUm6EM7_NcyJy9XSs84K7O_zik3irer4//?imgmax=800 "clip_image001[1]")
-- Could see a temporary technical rebound soon, but watch out for the bull trap. -- Baltic is not showing improvement. -- FXI is still weak. -- GLD and SLV showing weakness. -- World economy is still a mess. |
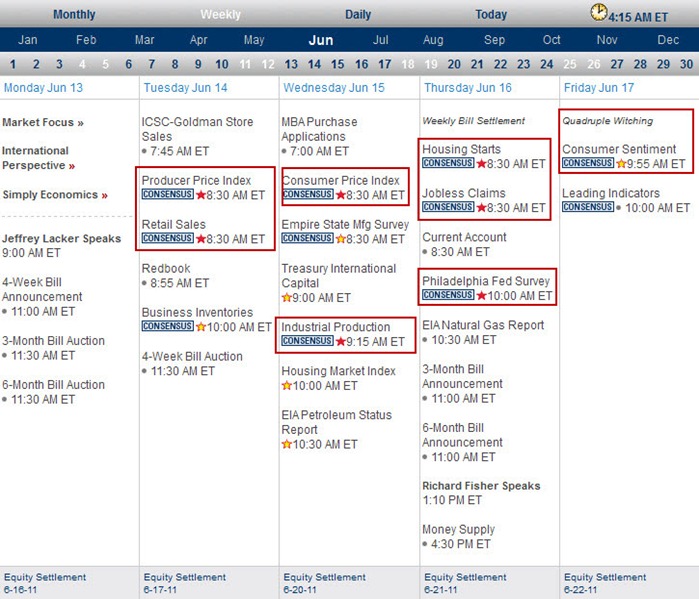
Next Week Economic Data:
Input:
- It is going to be a very heavy data week with quadruple witching on Friday.
- It is going to be volatile.
VXX chart:

Input:
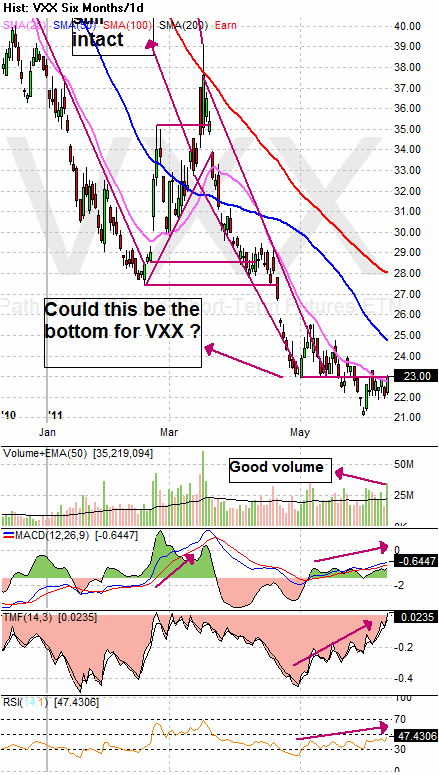
- Intraday has shown strong sign of life for VXX.
- Daily chart TMF reach the zero point again. MACD and RSI continue to point upward.
- A very high volume on Friday.
- Daily chart shows that it is now testing the 23.00 line again, and it is also above the 20MA.
SPY chart:

Input:
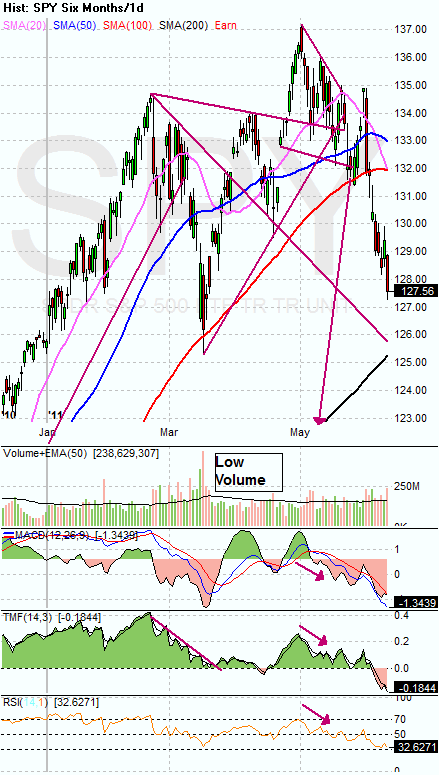
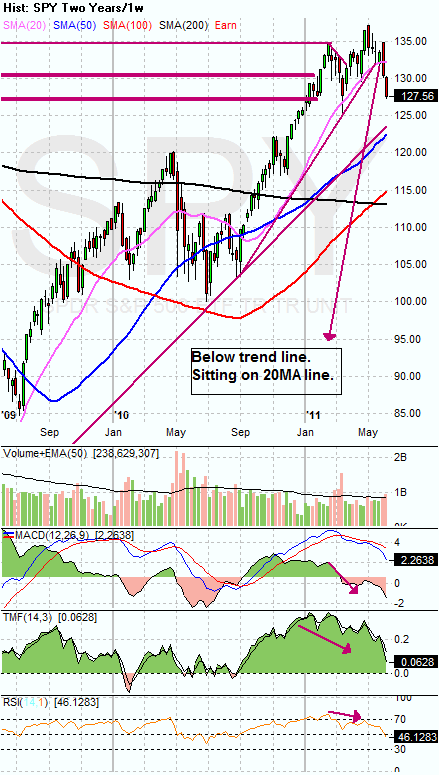
- Thursday was a perfect bull trap. Anyhow this could be the first trial for bull to challenge the bear.
- Daily and weekly chart show that there are some more room for SPY to drop. It has not get into any support line yet. 125 could be the support line.
DJIA chart:


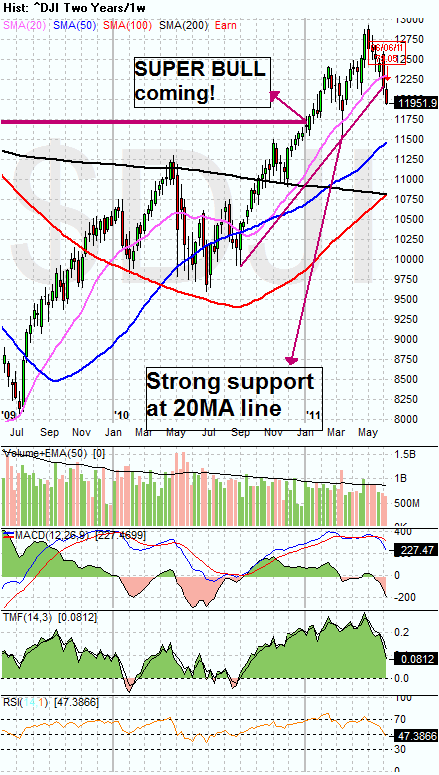
Input:
- Same for DJIA. More room to drop.
- Support line at 11700.
NASDAQ chart:
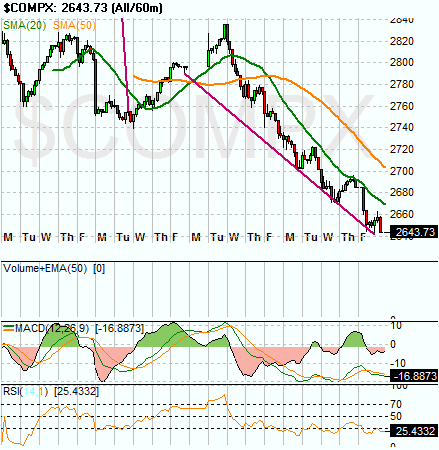
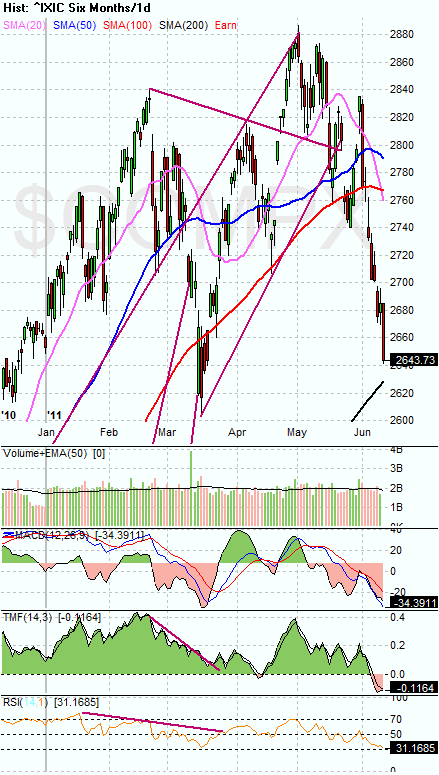
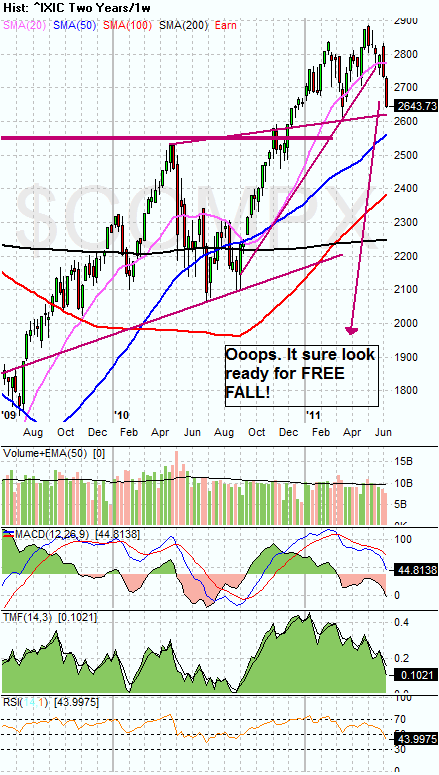
Input:
- Support line at 2630.
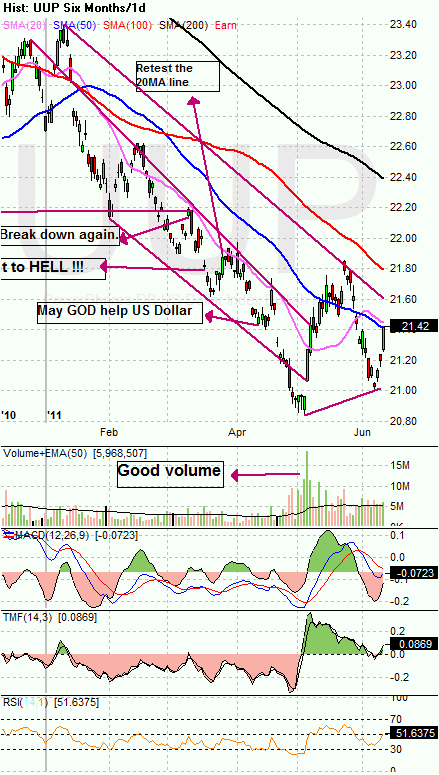
UUP chart:
Input:
- UUP is facing temporary resistance at $21.42. Retesting its 20MA and 50MA lines.
- Next resistance line is at $21.60. This will be a more genuine resistance line.
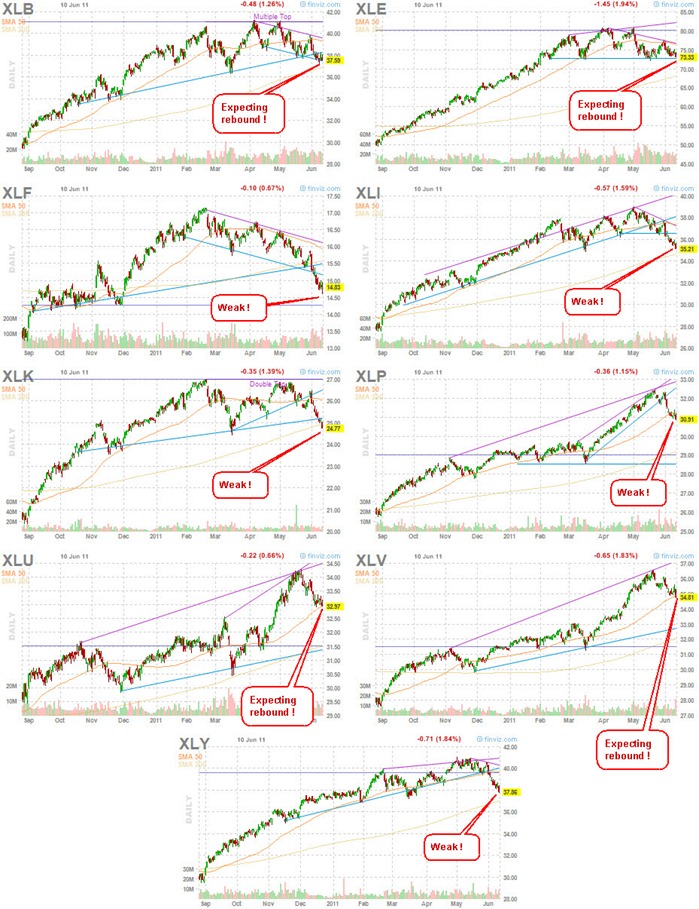
Sector Analysis:
Input:
- Sectors like XLB, XLE, XLU and XLV could see a temporary rebound.
- Others are still very weak.
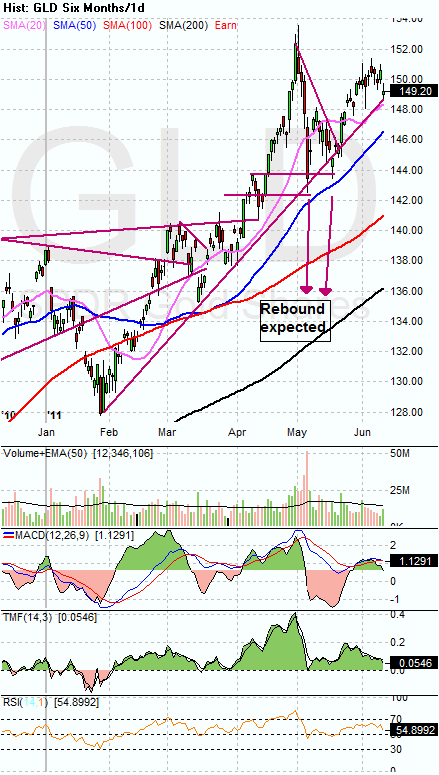
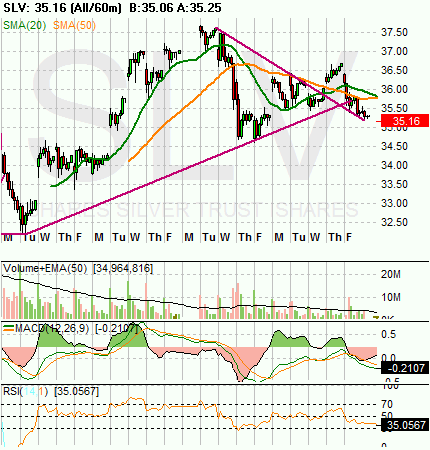
GLD, SLV, Petrol and Natural Gas charts:

Input:
- GLD retrace back to retest its up trend line.
- Intraday shows that a parabolic shape is taking place. It sure looks weak.
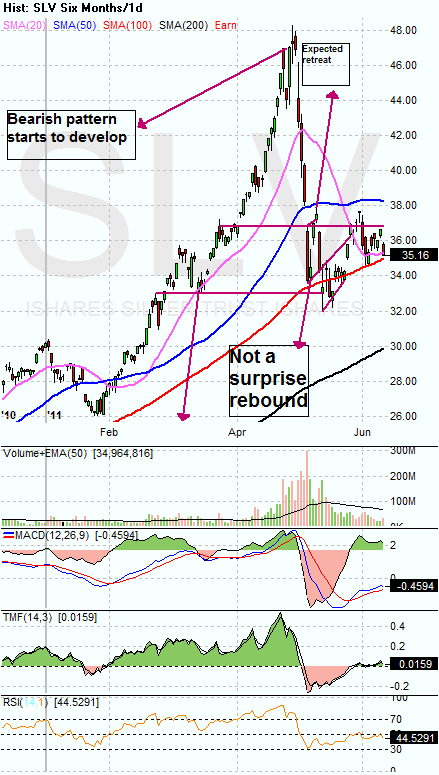
- SLV intraday shows that up trend line is broken.
- Daily chart shows that is has breached its 20MA line and now approaching to test the support line of 100MA line.
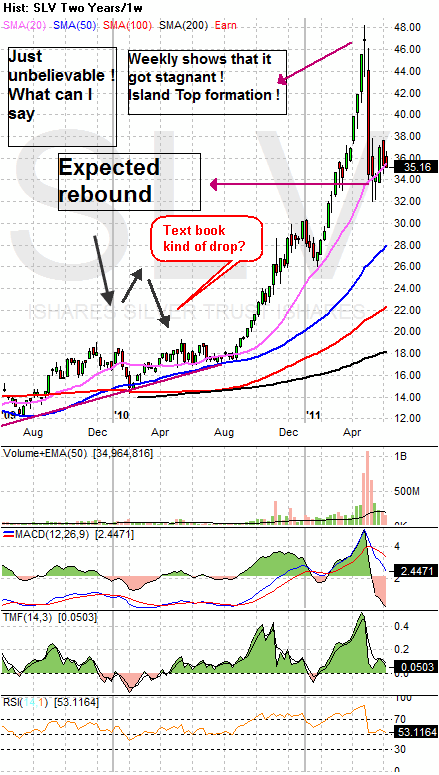
- Weekly SLV chart also shows that it has breached the 20MA line. It has also display similar pattern of dropped that you can read from the text book.
- This SLV thing is really interesting.
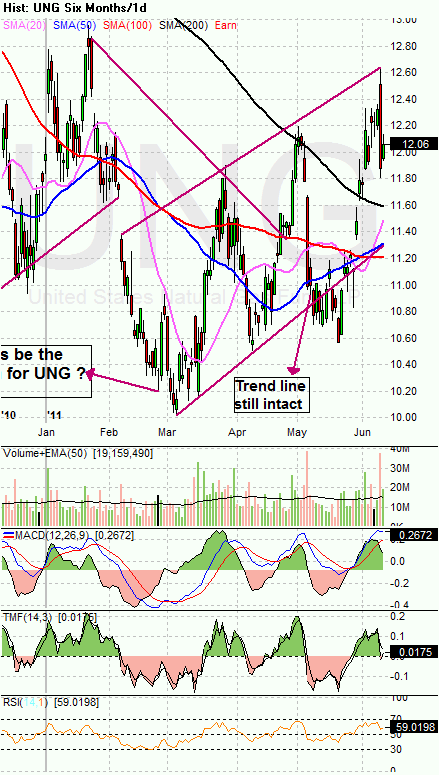
- UNG daily chart shows that it has taken out all the MA lines (20, 50, 100 and 200MA) and is still staying above them. This is bullish.
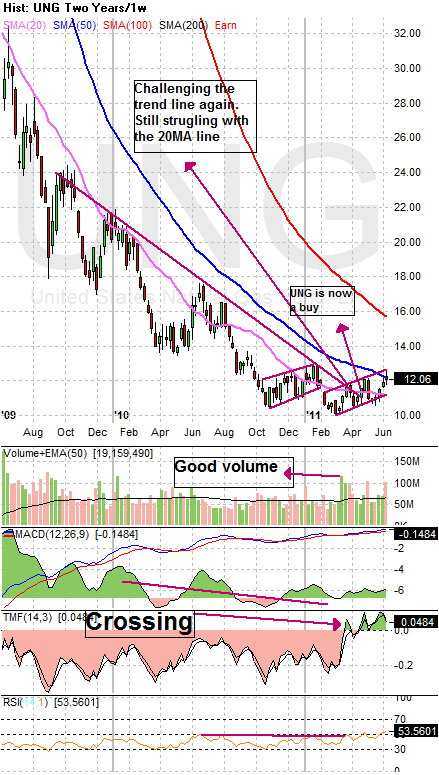
- Weekly UNG chart shows that it is still above its 20MA line and now resting on the 50MA line. It formed a two up pointing wedges patterns which looks like bottom has formed properly. Looks like UNG is a BUY again.
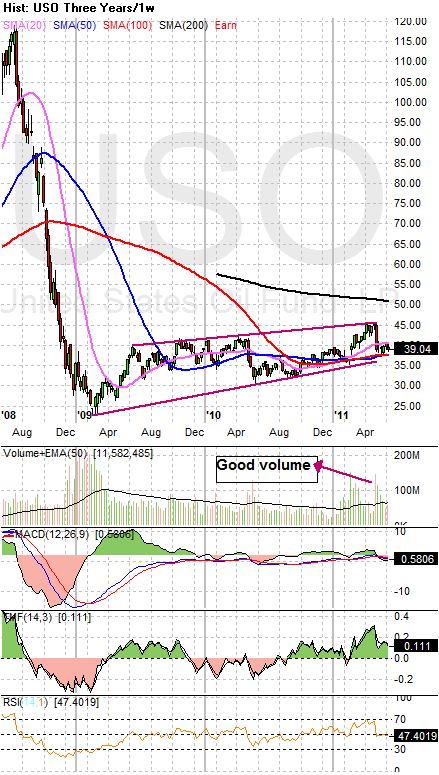
- Weekly chart USO price is still blocked by its 20MA line.
FXI (iShares FTSE / Xinhua China 25 Index Fund) chart:

Input:
- FXI is testing its trend line and also the 100MA line.
- The uptrend is still intact but weak
Baltic Dry Index chart:
Input:
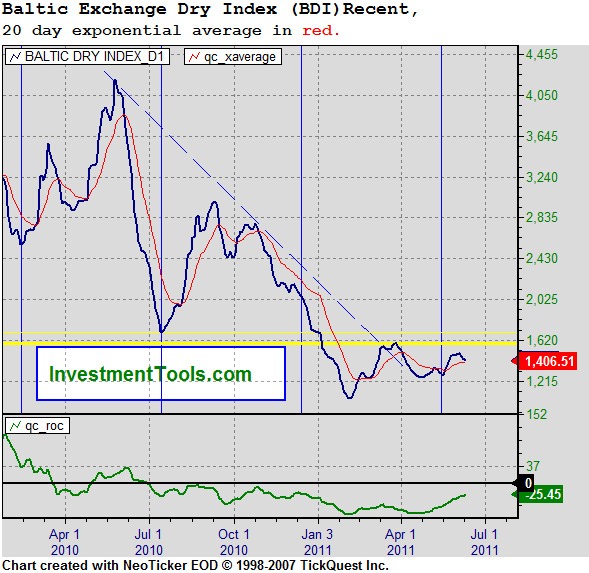
- Shipping is still flat. A lot of shipping stocks are in very bad shape.
- Don’t even go close to them.


![clip_image001[1]](https://blogger.googleusercontent.com/img/b/R29vZ2xl/AVvXsEhcygxUrlWtVFx-wTLrjZUWJBknuF39QbSAuknFdxT5lc-EBBLxJYFCCzUduJyIWUczz85ErSPXcc51nbqL9Hlhr6NH7nOjNkw_72pH0EBxhGbVIlhW3eQCCoo8mqW3Fv8vkONT09ifmv0/s1600-h/clip_image001%25255B1%25255D%25255B2%25255D.jpg "clip_image001[1]")


