BULL or BEAR ??
| Short term (1 week) | Long term (1 month) |
| 
-- VXX is still on its uptrend. -- UUP is still on its uptrend. -- All 3 indexes are still stuck in their range bound activity and forming more lower low and lower high. Their strong support line was briefly taken out but quickly retraced back. -- All sectors facing temporary resistance. -- USO is still in its down trend. -- UNG is the worst among all the commodities. -- GLD still stuck in the range bound activity and SLV still cannot retake its resistance line. | ![clip_image001[1]](https://blogger.googleusercontent.com/img/b/R29vZ2xl/AVvXsEi1_I4_fi-X5HAaqp4O7wfy_3MJ-u_g7JDKuFerHZu1Ak5I82YM4LgL0AD5ya7HqAgGOF6uGO3_uyK7sEZjPdtszs8nJWznGv2UBlHPpgHwIubDLMzkLoAP0zyZF0FBo_fjhfIoN9aNoqc//?imgmax=800 "clip_image001[1]")
-- Earning season starts soon. Might see bull trying to step in. -- Copper shows a strong high volume rebound from its support line, but overall it is still in down trend. -- Shipment still embark on its uptrend. Something that I cannot understand but need attention. -- Can't see any bullish sign for the market at all. |
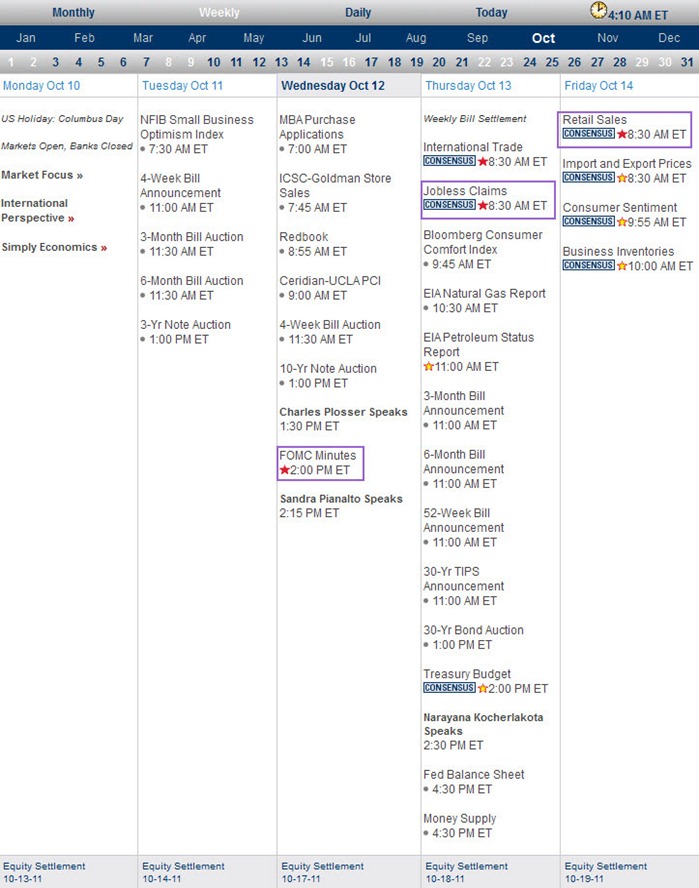
Next Week Economic Data:
Input:
- Very minimum data coming out next week. Expect the market is going to just follow the chart pattern rather than any unpredictable movement.
VXX chart:
Input:
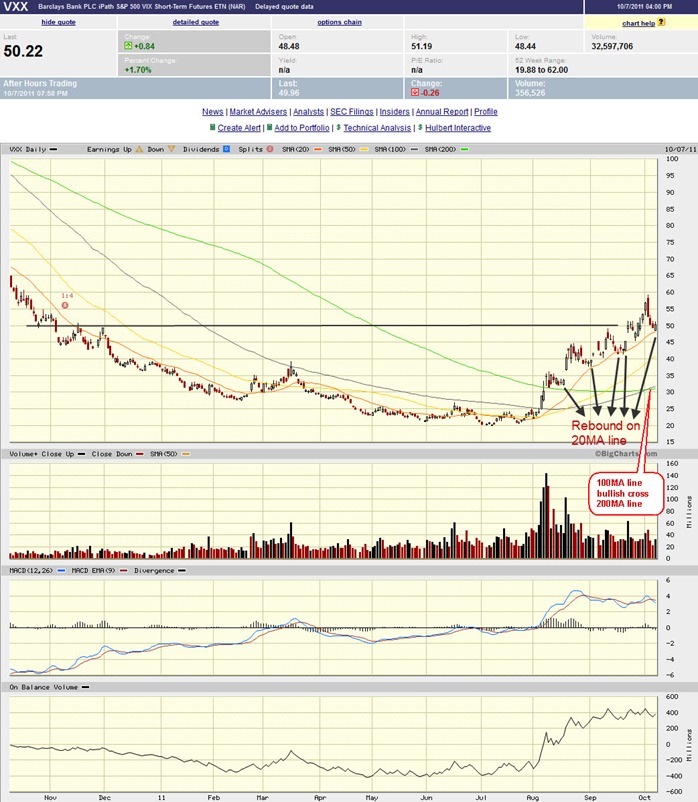
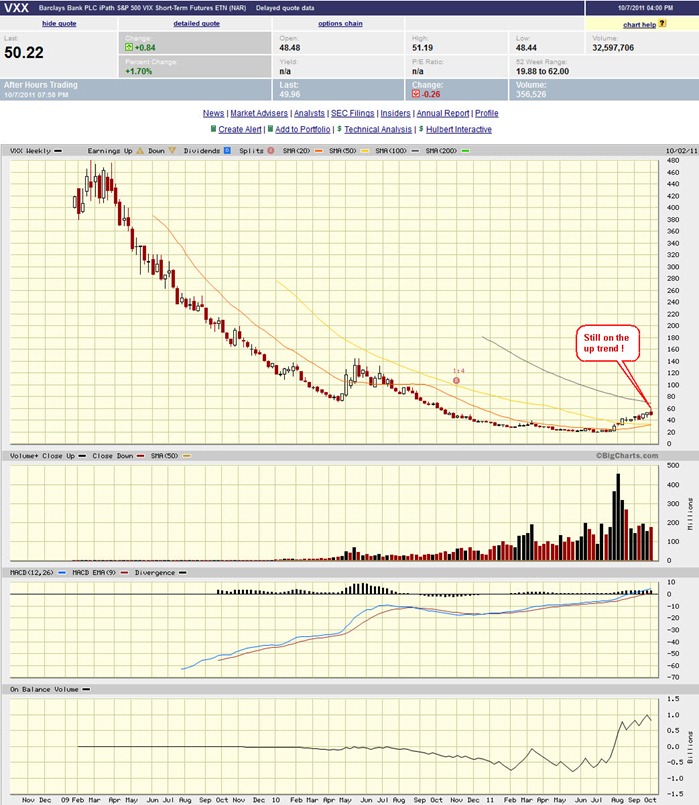
- VXX is still on its up trend.
- Weekly chart shows that it rebound at the weekly 20MA line.
SPY chart:
Input:
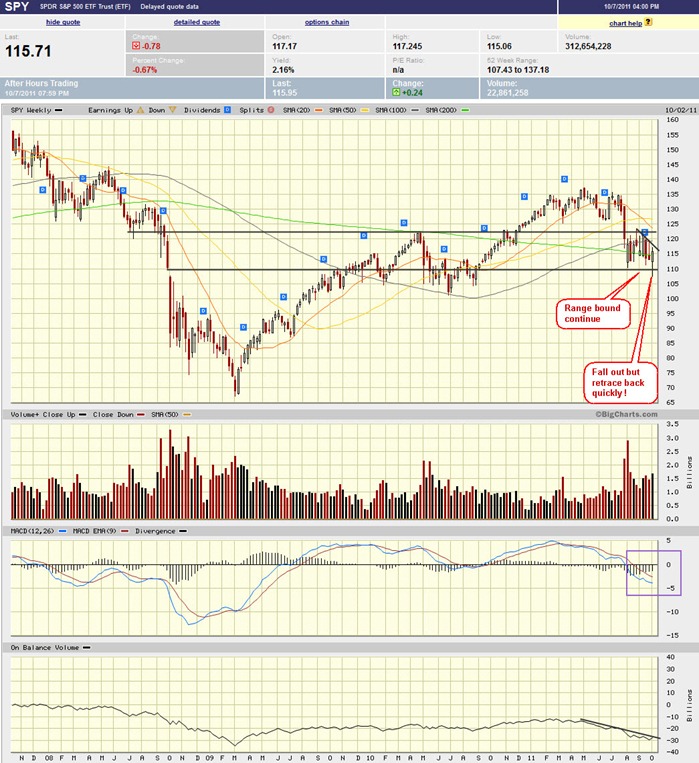
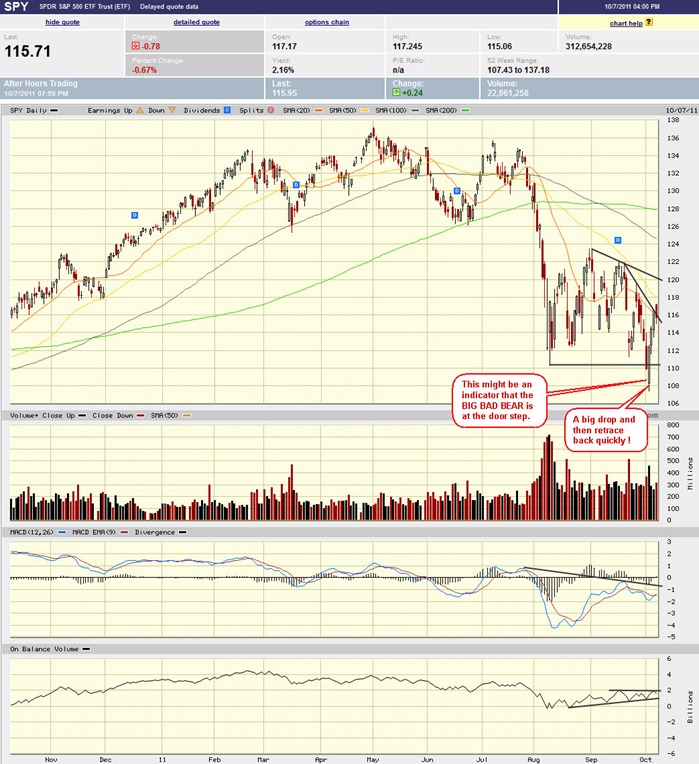
- Weekly and daily chart shows that the strong support line at 110 was broken, but was quickly retraced. This might be the first sign of a Big Bad Bear.
- Daily chart shows that 20MA line still act as resistance line.
- Both daily and weekly MACD still in down trend.
- Weekly chart shows that it rebounded and came back on top of 200MA line.
- More lower low and lower high have established in this range bound activity. This might indicate weakness.
DJIA chart:

Input:
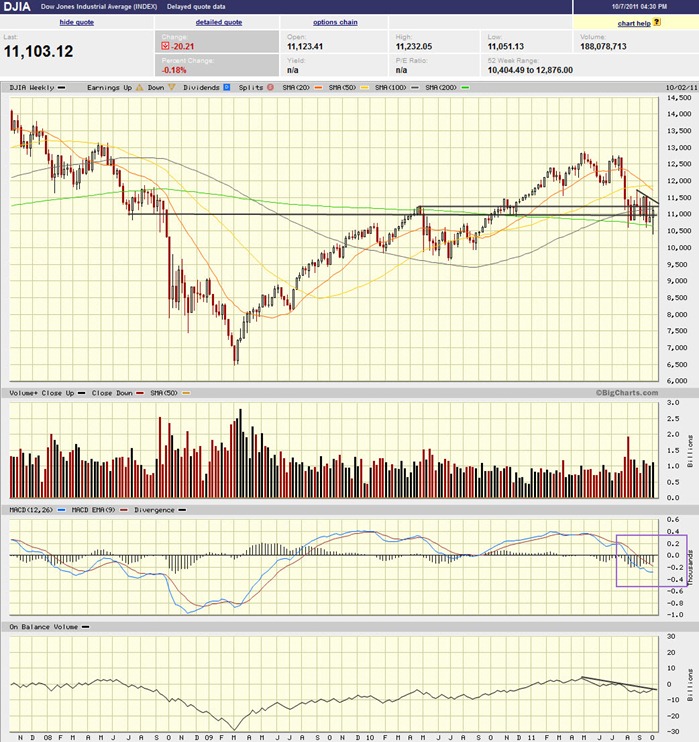
- Daily chart shows that it retest the 50MA line and now reclaim back 20MA line.
- Both daily and weekly MACD are still in down trend.
- However, daily OBV are on the rise.
- Weekly chart shows that it rebounded from 200MA line and now retest 100MA line.
- Same line SPY, more lower low and lower high was established and strong support at 10,600 line was broken and quickly retraced back.
NASDAQ chart:
Input:
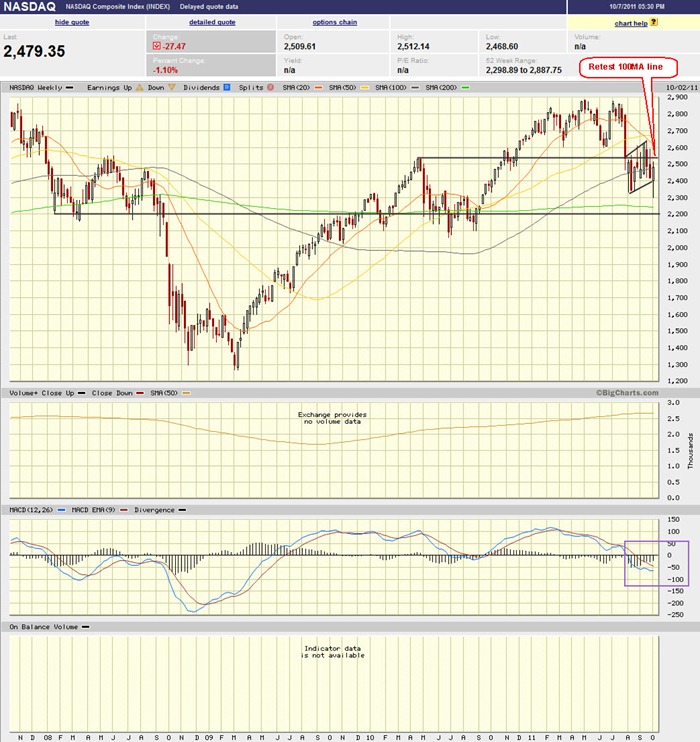
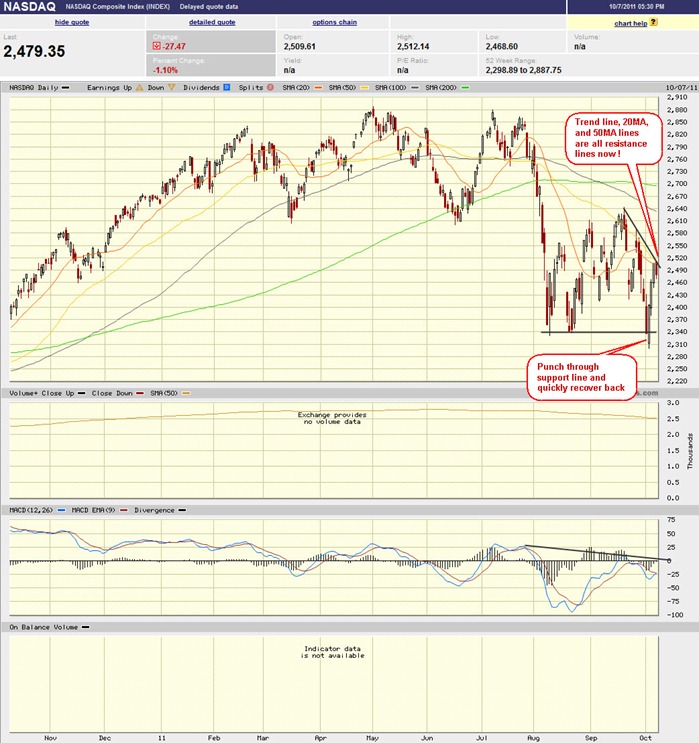
- Weekly chart shows that it is retesting 100MA line. It also shows that the trend line for the flag as once broken downward and quickly retraced back. Right now weekly 100MA line also act as resistance line.
- Daily and weekly MACD are still in down trend.
- Daily chart shows that it is facing strong resistance at 20MA and 50MA lines.
- Similar to SPY and DJIA, more lower low and lower high have established.
UUP chart:
Input:
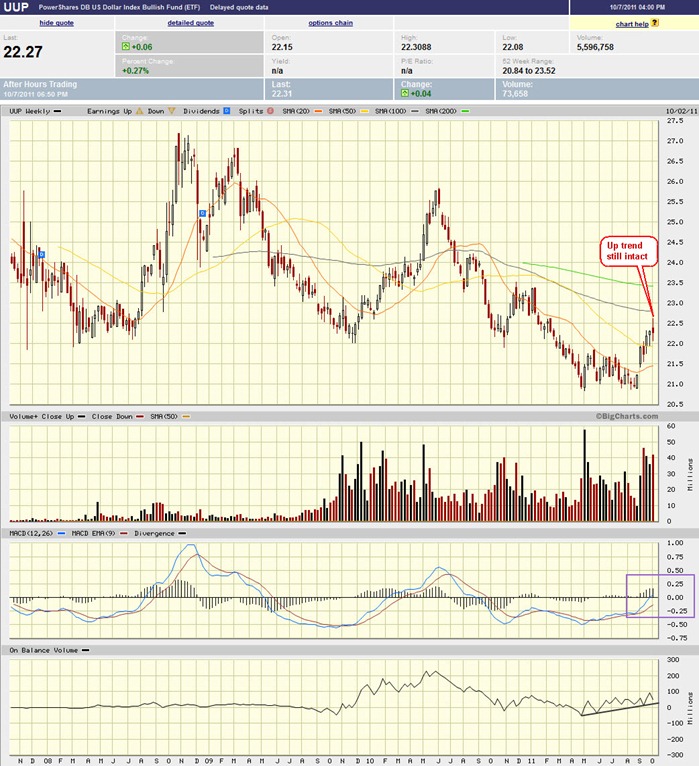
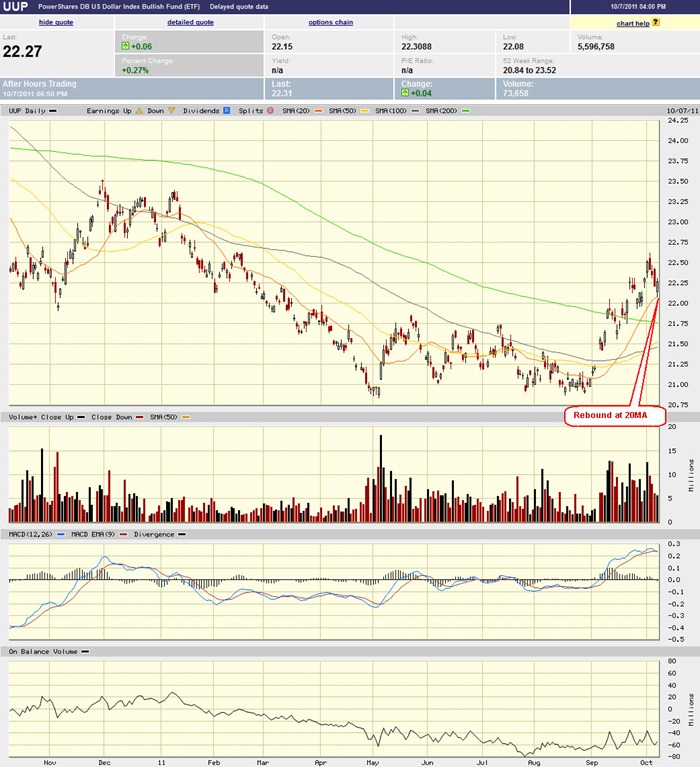
- Weekly and daily charts show that its up trend is still intact.
- Daily chart shows that it rebound at the 20MA line, but warn that MACD started to curve downward.
- Weekly MACD and OBV are still pointing upward.
- Very strong volume for the past one month.
Sector Analysis:
Input:
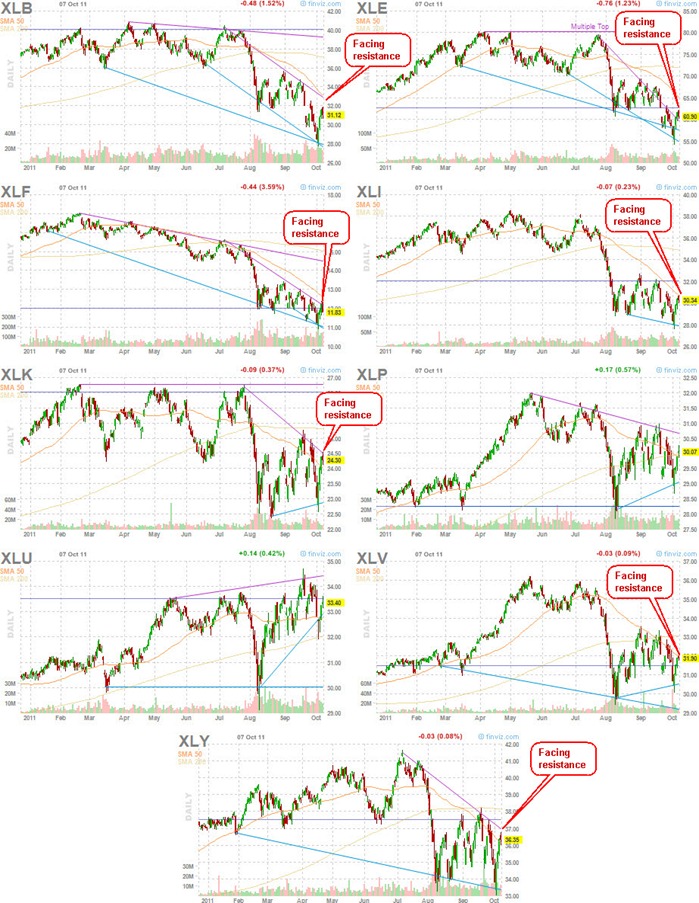
- Most sectors are again facing resistance line one way or another. Temporary retreat is expected.
GLD, SLV, Petrol and Natural Gas charts:
Input:
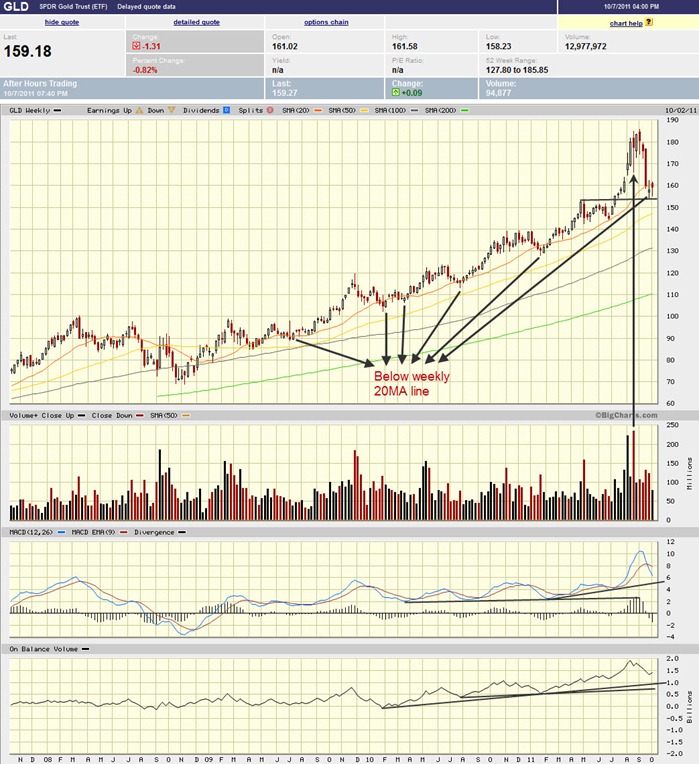
- Weekly GLD chart shows that it seem to find support at $155.00, but facing resistance at its 20MA line.
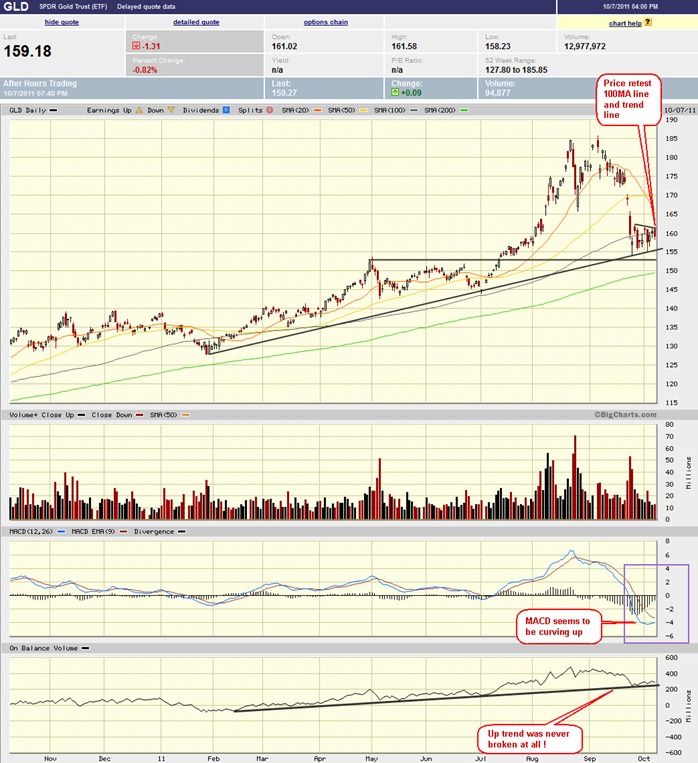
- Daily GLD chart shows that it has support from the trend line and now retest its 100MA line. Daily MACD also starting to curve up and its OBV uptrend was not broken at all.
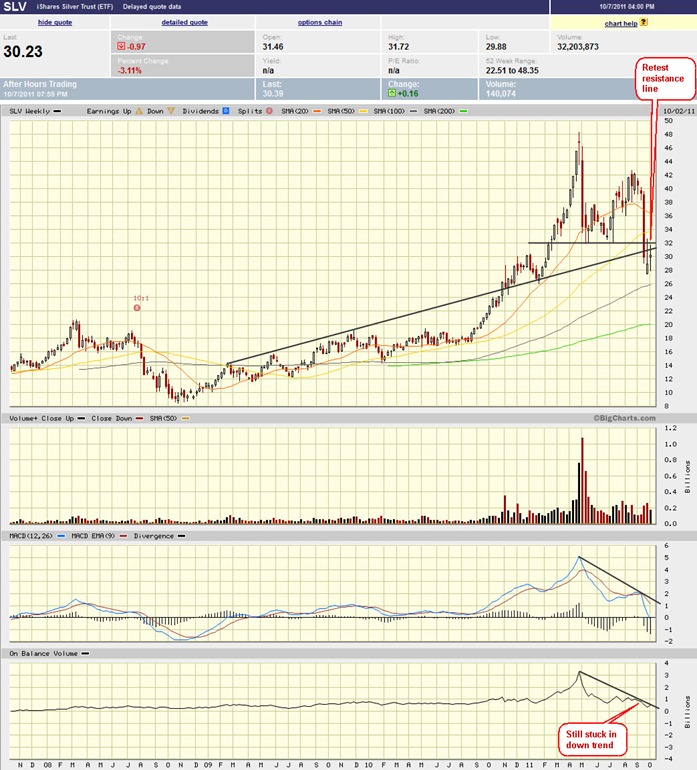
- Weekly SLV shows that it is facing resistance line at $32.00. Its weekly MACD and OBV are still in down trend.
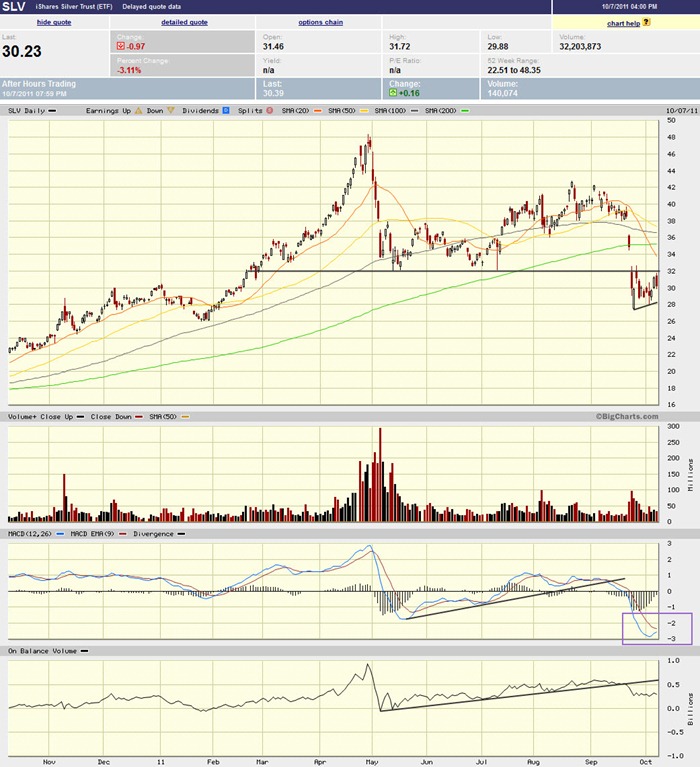
- Daily SLV chart shows that the price is still below all MA lines.
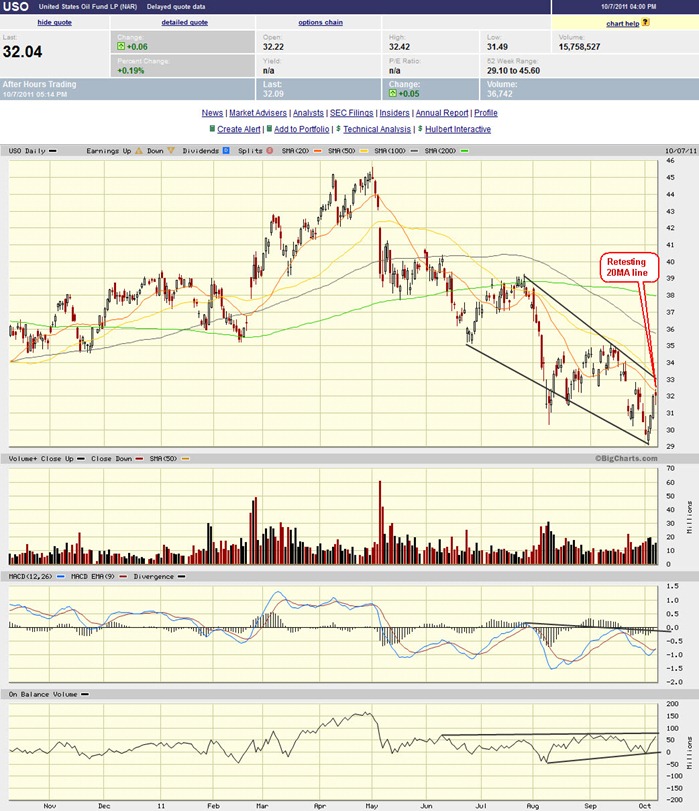
- Daily USO chart shows that it is still in down trend but retesting its 20MA line.
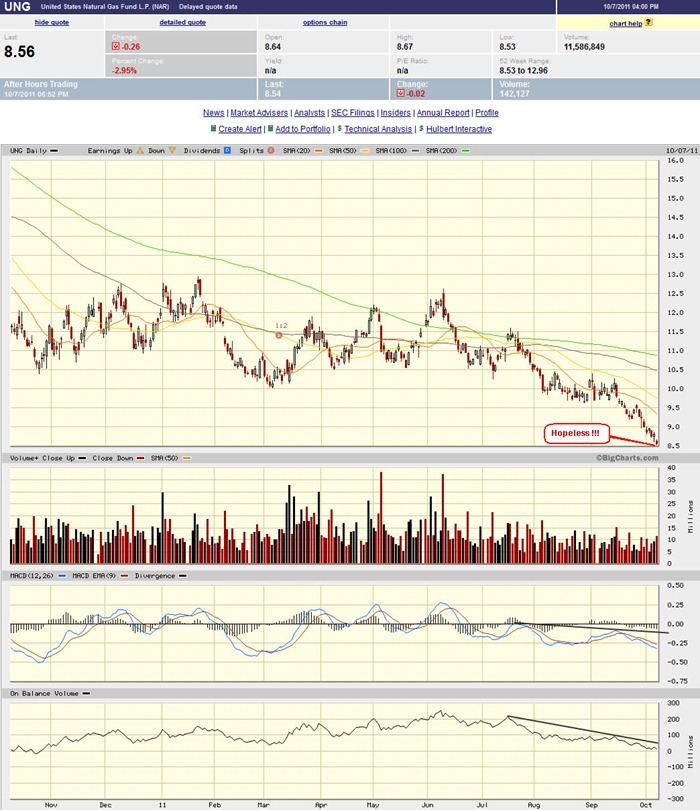
- UNG is such a terrible looser.
FXI (iShares FTSE / Xinhua China 25 Index Fund) chart:
Input:
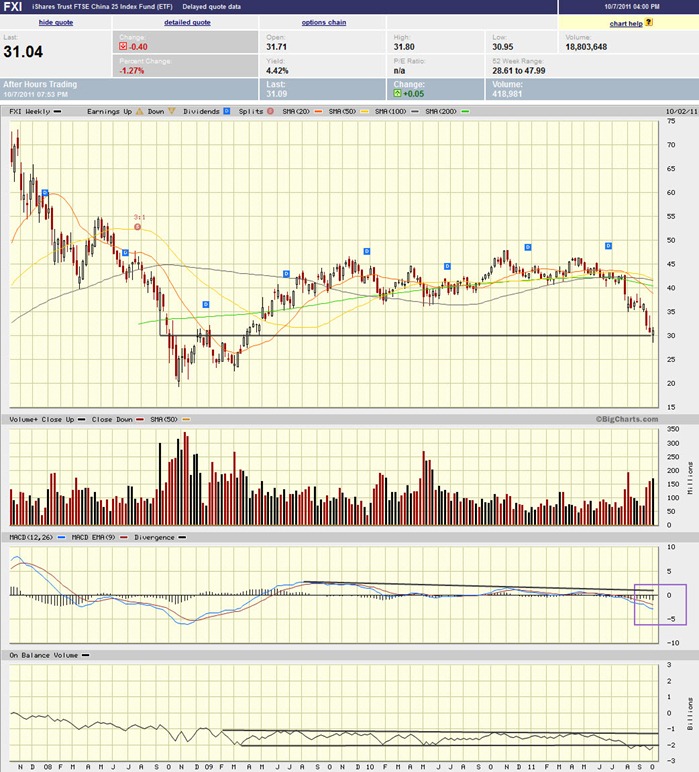
- Weekly FXI chart shows that it has support at 30.00 even though it was broken and quickly retraced back.
- Weekly MACD and OBV are still bucking on the down trend.
Copper JJC chart:
Input:
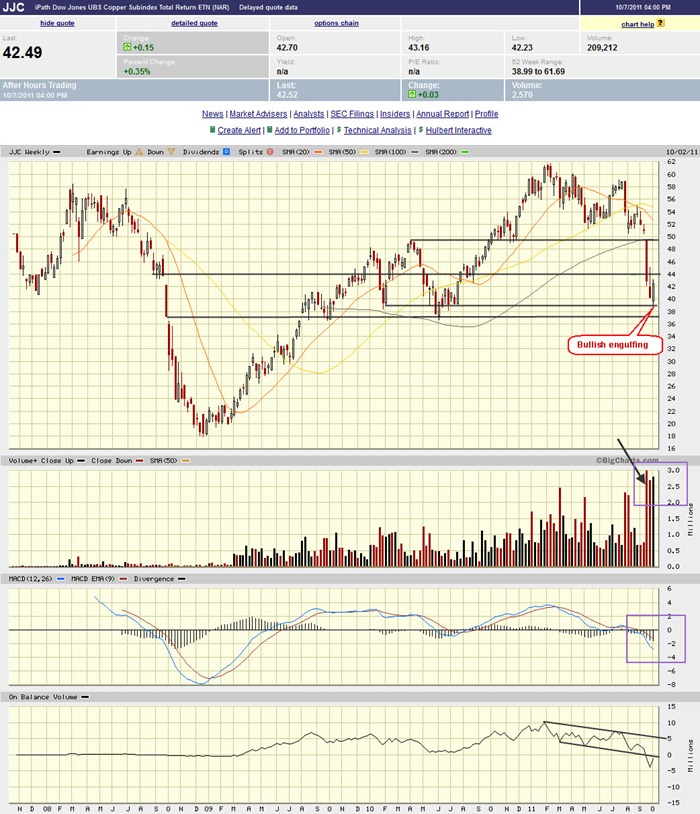
- Weekly Copper chart shows a strong rebound with high volume that formed a bullish engulfing pattern. Its strong support line is at 39.00.
- Weekly MACD and OBV are still on down trend.
Baltic Dry Index chart:
Input:
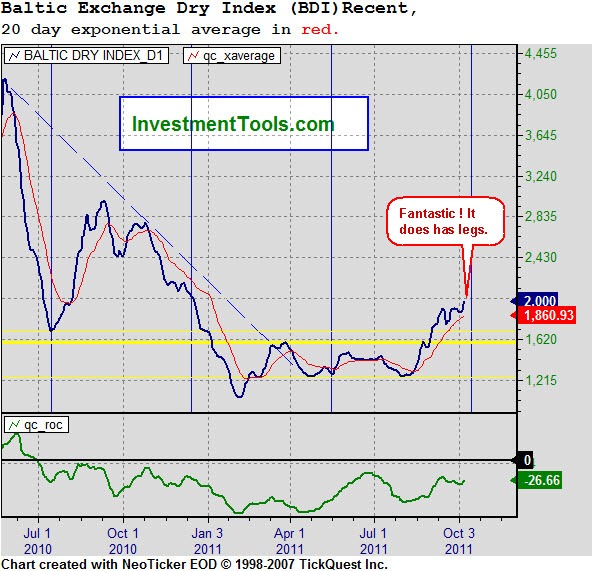
- The shipment rally does has legs to it.


![clip_image001[4]](https://blogger.googleusercontent.com/img/b/R29vZ2xl/AVvXsEhv4PrZII0Q4Kq-Q6oikCu9_sxI6uER9lkNRtgJ0sdnMPuFoReApPKVHXpgGo0ALiV1wn-tHD0hT12Ho6jGRAndWRsdsgEn5hXwtkvFWosI-JyLTgcWspi3tnAO2z3UK1DspsmyGeddGWc/s1600-h/clip_image001%25255B4%25255D%25255B2%25255D.gif "clip_image001[4]")
![clip_image002[4]](https://blogger.googleusercontent.com/img/b/R29vZ2xl/AVvXsEiojgcKnbfDSUrFNlTGXMuwbX3mBBYDQo_Ik0OcsUQog0lqQ2lx4wd1WL0bSMZ4ehCVNS5fSmnvzT31Tf7a_uYwqZBFXl4yP_YnEmBxBVeKcKNVE3xjx563-gWutJ8_WJVuhw_FrRPF5ho/s1600-h/clip_image002%25255B4%25255D%25255B2%25255D.gif "clip_image002[4]")
![clip_image003[4]](https://blogger.googleusercontent.com/img/b/R29vZ2xl/AVvXsEhhVSqm31_zBHnDRwJza7tuOq5rpGPGipwivrqQJh0gJyn6AD_Acg9SUdrd0EufKgdFUtDdvzoUpXcWhJhgjCREk8QscCy8KWkb96PcVaJQRknGPjp5y3eIe5RTk4n0Afy-72QviBKSgHU/s1600-h/clip_image003%25255B4%25255D%25255B2%25255D.gif "clip_image003[4]")

![clip_image001[1]](https://blogger.googleusercontent.com/img/b/R29vZ2xl/AVvXsEjkTQweJTEBPPtlfKO6m74PQfz42V4nIFYrMu0ywsZym7x5xnEXWmagYaa9hBZhjpCHIPGmo5dGkrPy-D94tLGhMyQgm7rgrGkfoZp5Lr5lARvrA0GVabVPVam8oNtE9ywCkXClv3aPl7g/s1600-h/clip_image001%25255B1%25255D%25255B2%25255D.jpg "clip_image001[1]")


