Friday, February 17, 2012

17th Feb 2012 – It is time to visit TheZOO!

Buy $

Sell $

Sell Short $

Buy Back $

Stop Loss $

Profit / Losses

Duration

25.20


23.10


index Reason for Buy / Sell / Short / Cover:


  1. The earning announcement at end of Jan has created a dropped in price.
  1. Intraday chart seems to indicate that the dropped has started to stabilize.
  1. Daily chart shows a very nice multiple bottom for 3 months time.
  1. Weekly chart shows that it is coming to the support at 200MA line.
  2. Monthly chart also shows that it is coming to the support of long term up trend line.


Lesson Learnt:


  1. Have been monitoring this stock for more than a year on and off.
  1. Could this be the bottom, finally?


Intraday Chart

clip_image001


Historical Chart

clip_image002


clip_image003


clip_image004

17th Feb 2012 – Sunset is in, it is time to go home.

Buy $

Sell $

Sell Short $

Buy Back $

Stop Loss $

Profit / Losses

Duration


3.36


Profit

2 months 16 days


index Reason for Buy / Sell / Short / Cover:


  1. Intraday chart continue to show weakness.
  2. Daily chart shows that it has dropped below 20MA line, as well as the up trend line and the previous support line.
  3. Weekly bearish Harami candle is formed.
  4. Quarterly announcement should be very close now.


Lesson Learnt:


  1. Similar to CSIQ, I should have sold this few days back.         ;-)
  2. Let's wait for it to announce quarter result first and we will be back then.


Intraday Chart

clip_image001


Historical Chart

clip_image002


clip_image003

17th Feb 2012 – It is night time in Canada.

Buy $

Sell $

Sell Short $

Buy Back $

Stop Loss $

Profit / Losses

Duration


3.58


Profit

3 months 8 days


index Reason for Buy / Sell / Short / Cover:


  1. Solar sectors have been dropping pretty heavily for the past few days.
  2. ENER actually has a good chart but surprise to see it at Chapter 11.
  3. Intraday chart yesterday night show a good strong start, but die off in just about an hour.
  4. Daily chart shows that price has broken down through the 20MA line and now start to go below the up trend line.
  5. Weekly chart shows a bearish Harami candle formation.


Lesson Learnt:


  1. I should have sold it few days back.           ;-)
  2. Quarter earning announcement should be quite close already. I think it is better to keep away from them first until after announcement.


Intraday Chart

clip_image001


Historical Chart

clip_image002


clip_image003

Thursday, February 16, 2012

16th Feb 2012 – Pattern Study - “A” knee jerk.

Ticker:


  1. A


Topic:


  1. 5% dropped after earning announcement.


Lesson Learnt:


  1. This is the beauty of the stock market. From the mid of Dec 2011 till now, A stock has rallied 36% and now the earning has just dropped it 5%. There are still a lot of margin to play with.
  1. Overall the chart still look healthy. In fact, I am thinking that the opportunity for top up is coming soon around $39.00.
  2. I believe this stock is still a HOLD. Should be good for a long term play.


Intraday Chart

clip_image001


Historical Chart

clip_image002


clip_image003

15th Feb 2012 – Pattern Study – A bull in AMD chip.

images Ticker:


  1. AMD


Topic:


  1. AMD processor seems to be running higher.
  1. There is a bull in the chip!


Lesson Learnt:


  1. A very strong intraday chart that shows continuous upward move.
  1. Daily chart shows that price has been rallying for the past 2 months, non-stop.
  1. All the daily MA lines are taken out.
  1. Weekly chart also shows that the price has just taken out the last resistance MA line, the 100MA line.
  1. Monthly chart is even more interesting. The price now is challenging with the long tern 20MA line.


Intraday Chart

clip_image001


Historical Chart

clip_image002


clip_image003


clip_image004

Wednesday, February 15, 2012

15th Feb 2012 – Pattern Study – Perfect ENERgy Black Hole !

index Ticker:


  1. ENER


Topic:


  1. A perfect ENERgy Black Hole!


Lesson Learnt:


  1. A almost 650% rally from the bottom of $0.20 in ENER turned out to be a perfect ENERgy Black Hole.
  2. Any stock technician who got in is sure to get burnt.
  3. The only way to avoid this is to invest in fundamental analysis.
  4. I was almost in there, but this time I am a bit lucky.
  5. Actually there were a few newsletter warning about more solar company are on the verge of collapsed and bankruptcy. May be I should just let go my holding on other solar companies.


Intraday Chart

-NA-


Historical Chart

clip_image001


clip_image002

15th Feb 2012 – Pattern Study – Valentine’s Day effect, Love is in the air!

index Ticker:


  1. SPY


Topic:


  1. Should have a good reason why such volume came in before market end to pull index back to positive territory.
  1. Could it be because of Valentine's Day!?          ;-)


Lesson Learnt:


  1. Overall, SPY still look quite healthy.
  1. All indexes open with drops due to the downgrade of Italy, Spain and etc by Moody.
  2. Just minutes before market close, big volume came in and pull the index back to positive territory.
  3. Such move should indicate bullishness for next day market.


Intraday Chart


clip_image001


Historical Chart

clip_image002

Tuesday, February 14, 2012

14th Feb 2012 – My Valentine SOHU

Buy $

Sell $

Sell Short $

Buy Back $

Stop Loss $

Profit / Losses

Duration

51.00


45.60


images Reason for Buy / Sell / Short / Cover:


  1. Long term monthly chart shows that it has again dropped back near to its long term uptrend line.
  2. Daily and weekly chart shows that the entry should be pretty save.


Lesson Learnt:


  1. Before the earning announcement, it was rallying. After earning announcement, it dropped and created this opportunity for entry.
  2. Long term uptrend still look healthy and looks like it should continue its uptrend.
  3. This should be a pretty strong stock and it is already 50% below its all time high.


Intraday Chart

clip_image001


Historical Chart

clip_image002


clip_image003


clip_image004

Sunday, February 12, 2012

12th Feb 2012 – My Analysis

BULL or BEAR ??


Short term (1 week)

Notes

clip_image001

-- Volatility is expected. Many data coming out on Thursday and Friday.

-- All 3 indexes long term charts still look healthy.

-- Be careful of the VXX indicator.

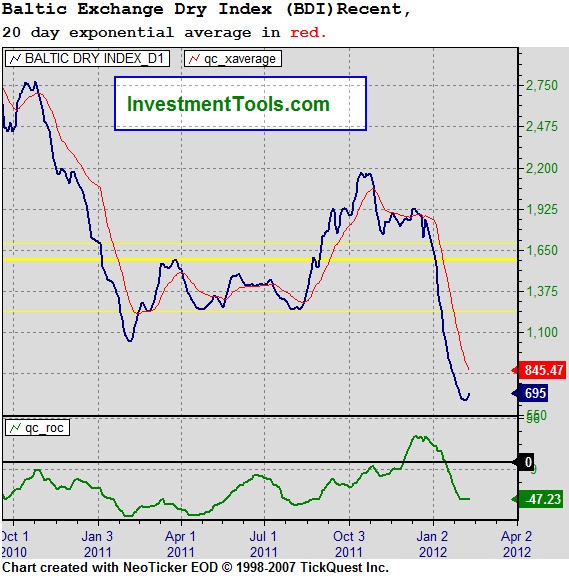
-- Shipping Baltic starting to take a turn. Many shipping stocks have turn positive.

-- UUP is still under the long term down trend, which is good for the market.

-- GLD and SLV market is still waiting for more decision on where to head to next.

-- UNG bottoming process still in progress.

-- FXI still show weakness.

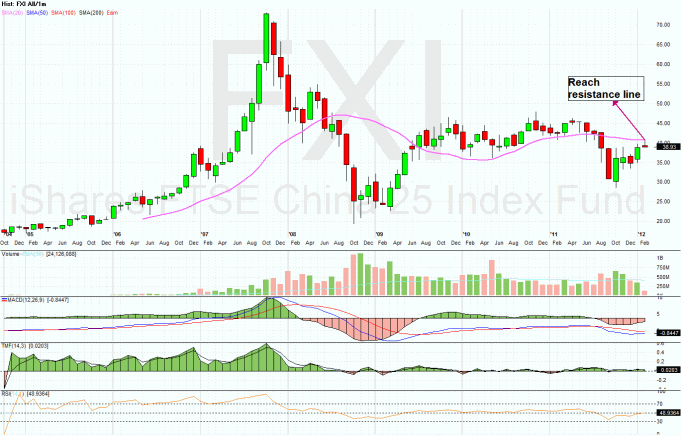
-- All sector ETFs still look healthy.


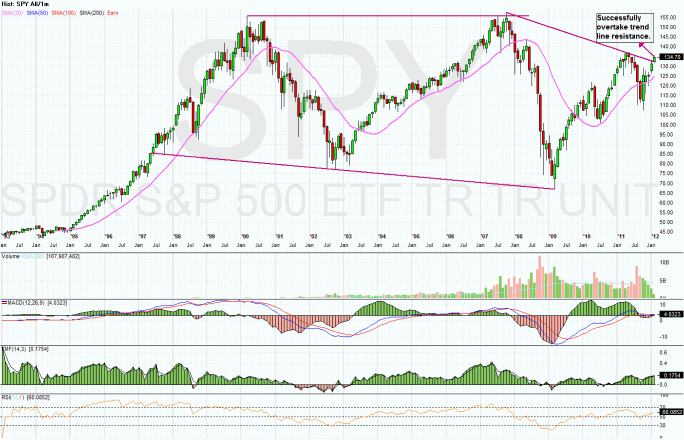
SPY (30 years monthly) chart:


clip_image002


Input:


  1. Long term monthly SPY chart still look healthy.
  1. Last week retracement is considered as minor correction. Expect some more this coming week.


Next Week Economic Data (1 week):
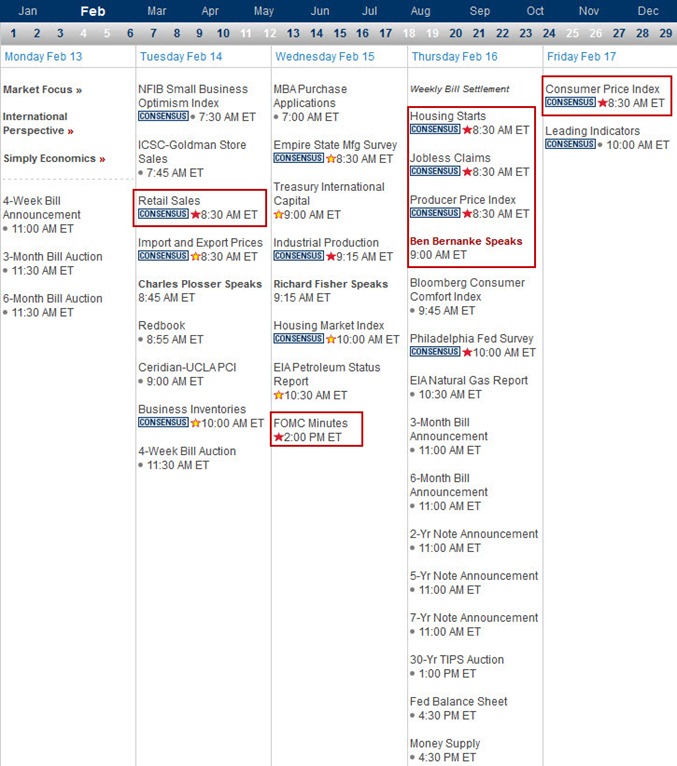
 

clip_image003


Input:


  1. Expect some volatility coming week.
  1. CPI, Job, Fed, PPI and FOMC all falling on Thursday and Friday.


VXX chart:
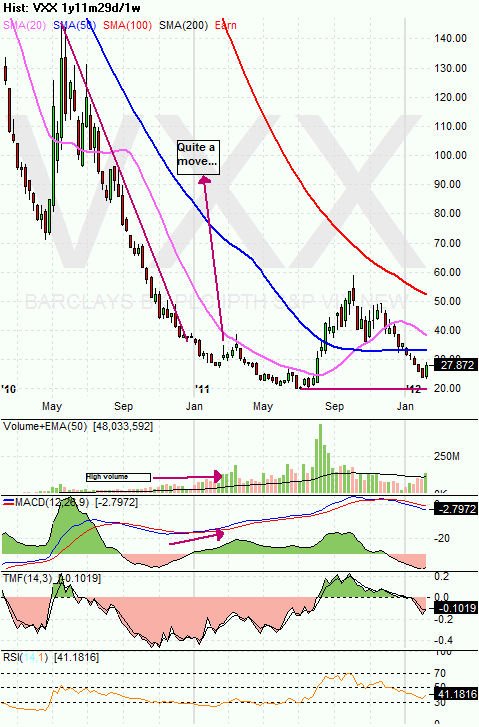
 

clip_image004


Input:


  1. Look at the flatness of the 50MA line. Amazing !


SPY chart:
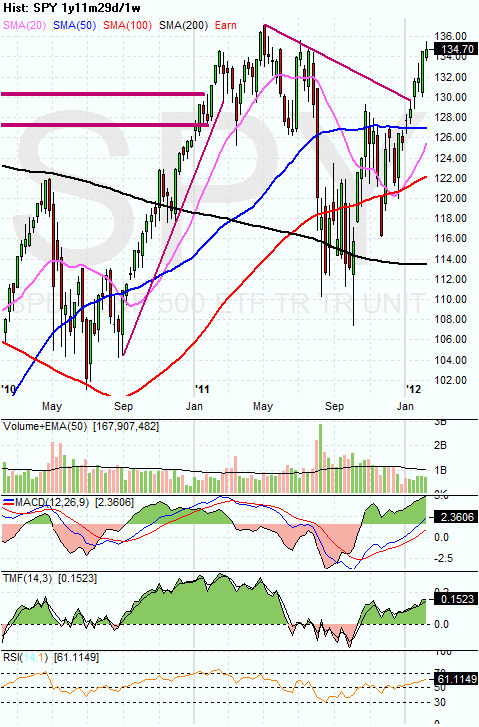
 

clip_image005


Input:


  1. Weekly SPY chart still look healthy.


DJIA chart:
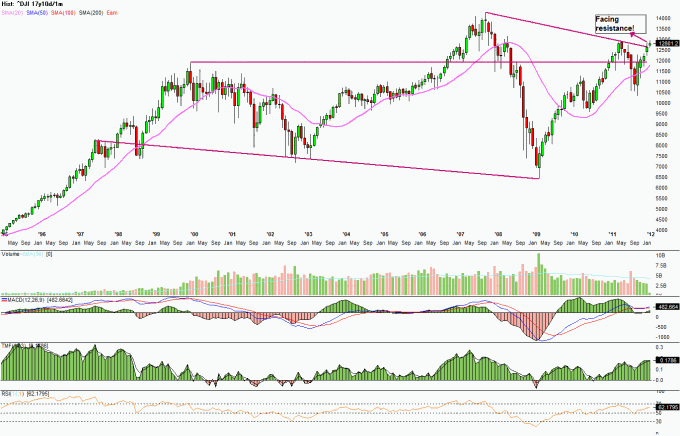
 

clip_image006


Input:


  1. Long term monthly DJIA chart look healthy.


NASDAQ chart:
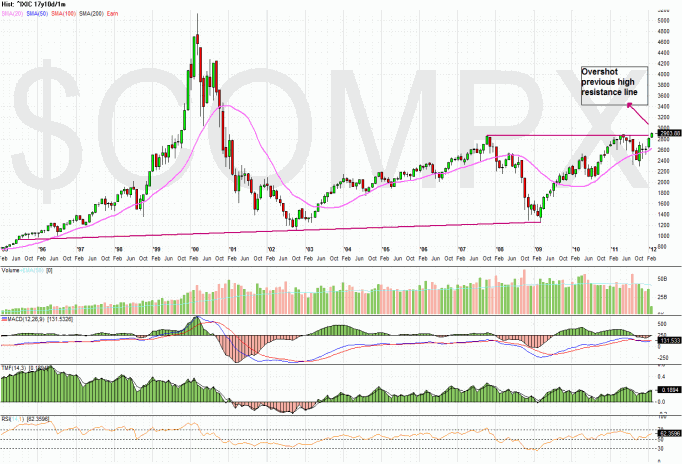
 

clip_image007


Input:


  1. Long term monthly NASDAQ chart look healthy.


UUP chart:


clip_image008


Input:


  1. UUP is still in the long term down trend.


Sector Analysis:


clip_image009


Input:


  1. All sectors look healthy.


Copper JJC  chart:


clip_image010


Input:


  1. Copper is still under the control of long term 20MA line.


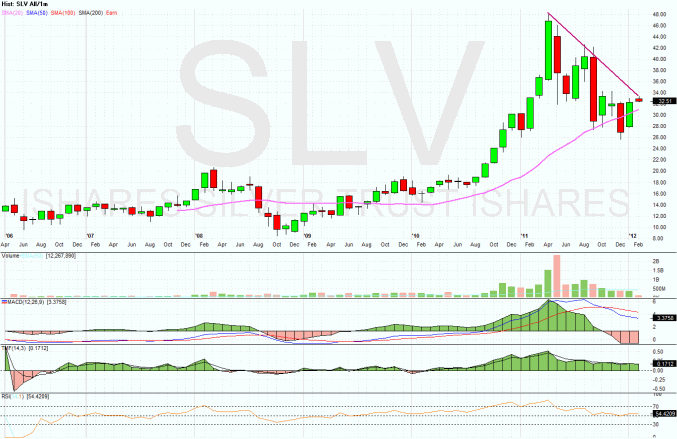
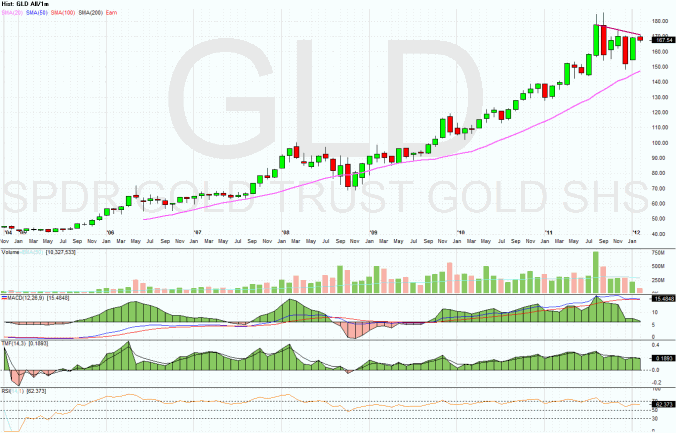
GLD and SLV charts:
 

clip_image011


clip_image012


Input:


  1. GLD and SLV are still behaving well under the trend line.
  2. Secondary indicators seem to indicate possible down trend in the future.


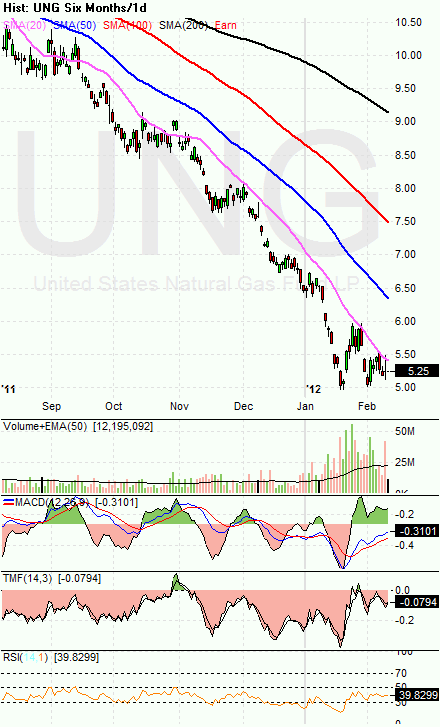
 Petrol and Natural Gas charts:


clip_image013


clip_image014


Input:


  1. USO still staying on the long term 20MA line.
  2. UNG bottoming process still has not ended. Not time for entry at all yet.


FXI (iShares FTSE / Xinhua China 25 Index Fund) chart:
 

clip_image015


Input:


  1. FXI is still weak. Not able to take out the 20MA resistance line.


 Baltic Dry Index chart:
 

clip_image016


Input:


  1. It is taking a interesting turn.
  1. Some shipping stocks have actually turned around.