Tuesday, February 15, 2011

15th Feb 2011 – Pattern Study - HAWK

Ticker:


  1. HAWK


Topic:


  1. Black Hawk DOWN !
  2. When one of the BEST multiple bottom chart pattern FAILED !


Lesson Learnt:


  1. Things can go real bad even for the best technician/trader.
  2. Fundamental of the company still has the final say.


Intraday Chart

-NA-

Historical Chart

clip_image001


clip_image002

Monday, February 14, 2011

14th Feb 2011 – Pattern Study – CKEC (coming to the theater near you !)

Ticker:


  1. CKEC


Topic:


  1. Triangle Setup


Lesson Learnt:


  1. Looks profitable for LONG entry.


Intraday Chart

clip_image001


Historical Chart

clip_image002

Sunday, February 13, 2011

13th Feb 2011 – My Analysis

BULL or BEAR ??


Short term (1 week)

Long term (6 months)

clip_image001

-- There is basically "nothing" that comes to stop the rally.

-- VXX has no sign of bottom yet.

-- Watch out for all time high NASDAQ.

-- SPY could be in progress of forming a head-n-shoulder if you look at it from helicopter point of view, but even that, it has a long way to go up before the right shoulder is formed.

-- UUP still has some time before it comes to form a multiple bottom.

-- Many sectors have poke through its uptrend line upward.

-- GLD still embarked on its downtrend while SLV could follow with a possible head-n-shoulder formation.

-- FXI is somehow at a critical junction. Friday's USA rally should help to rally FXI market.

-- Murbarak from Egypt stepping down.

-- UNG is the weird one. What a toxic gas.

clip_image002

-- From now on, I think I will this column blank.

-- So far, I don’t think this column helps me. It does not do any harm, but…..


Next Week Economic Data:


clip_image003


Input:


  1. A bit of important data coming out. Expect a bit of volatility in the middle of week.


VXX chart:


clip_image004


Input:


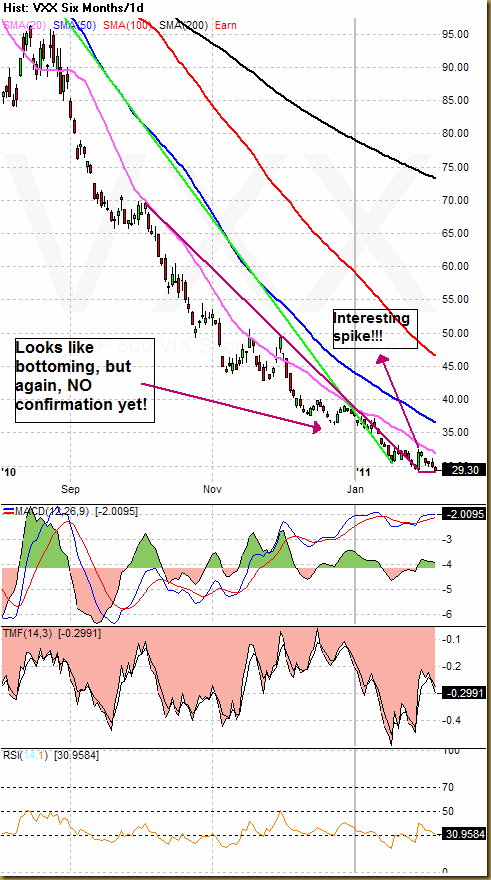
  1. The VXX chart looks really crazy, but you just have to accept it. You have no idea how low can it still go.


SPY chart:


clip_image005


clip_image006


clip_image007


Input:


  1. What a BULL market.


DJIA chart:


clip_image008


Input:


  1. Very Bullish.


NASDAQ chart:


clip_image009


Input:


  1. NASDAQ is hitting an all time high. What is it going to bring us to?


UUP chart:


clip_image010


Input:


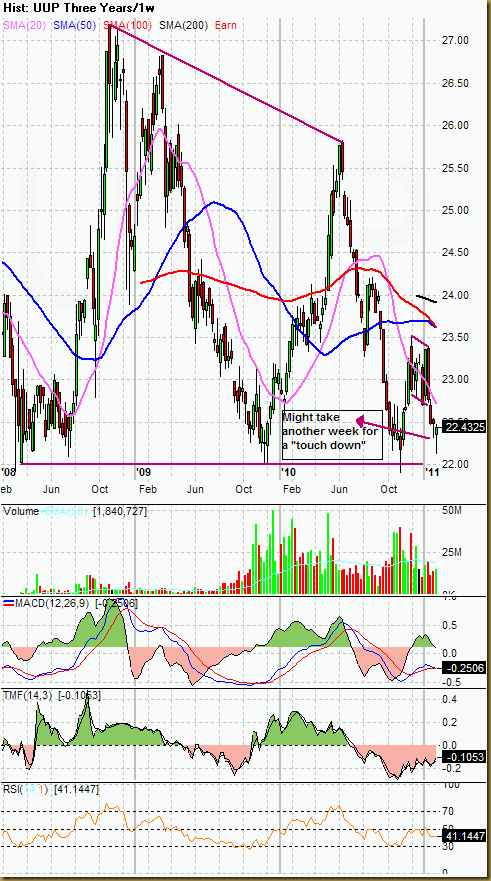
  1. UUP down trend is still intact. Watch out for multiple bottom formation.


Sector Analysis:


clip_image011


Input:


  1. Many sectors have gone beyond its uptrend line.


GLD, SLV and Natural Gas charts:


clip_image012


clip_image013


clip_image014


Input:


  1. GLD's rebound is not as hard as SLV.
  2. GLD has not overcome its Head-n-Shoulder downtrend yet.
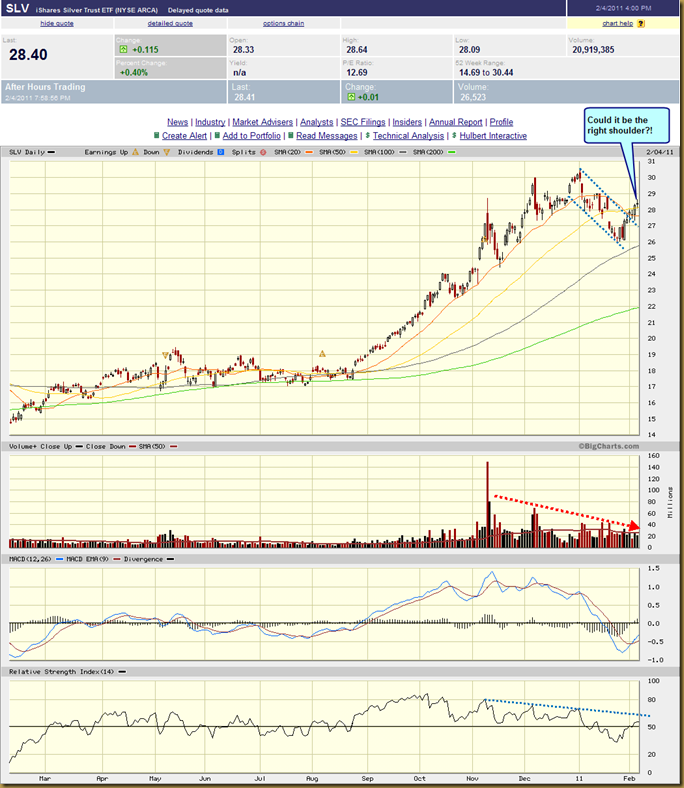
  3. SLV looks like forming a Head-n-Shoulder pattern.
  4. SLV is one step slower than GLD, so if GLD had completed a Head-n-Shoulder, SLV should be taking the similar step.
  5. UNG -- What a TOXIC gas. Coming for a double bottom. Read this article from FORTUNE http://money.cnn.com/2011/02/11/news/economy/chesapeake-natural-gas-shakeout.fortune/index.htm


FXI (iShares FTSE / Xinhua China 25 Index Fund) chart:


clip_image015


Input:


  1. FXI looks like still in down trend.
  2. Is it in a Head-n-Shoulder pattern?


Baltic Dry Index chart:


-NA-


Input:


  1. -NA-

Friday, February 11, 2011

11th Feb 2011 – Pattern Study - AKAM

Ticker:


  1. AKAM


Topic:


  1. Perfect Head-n-Shoulder


Lesson Learnt:


  1. Try not to go long at this kind of head-n-shoulder formation especially when it is due for quarterly report. The reason that the head-n-shoulder has formed is basically telling you that the institution who has got information already letting go this stock.


Intraday Chart

-NA-


Historical Chart

clip_image001

11th Feb 2011 – Pattern Study – Have you driven a Ford lately?

Ticker:


  1. F


Topic:


  1. Double Top


Lesson Learnt:


  1. Quarterly report out, trend line broken and double top formation confirmed --- You just have to let it go.
  2. Will there be the next shorting point as shown in the chart?


Intraday Chart

clip_image001


Historical Chart

clip_image002

11th Feb 2011 – China kind of YouTube?

Buy $

Sell $

Sell Short $

Buy Back $

Stop Loss $

Profit / Losses

Duration

30.50


29.15


Reason for Buy / Sell / Sell Short / Buy Back:


  1. A small little gap at intraday open drove my adrenalin to get in on that day.


Lesson Learnt:


  1. Intraday 20MA line still show that price is still beneath it, so there could still be drawn downward by it.
  2. I should have been more patient and follow the intraday entry rule.
  3. This is the 2nd time I bought a "new kid on the block".
  4. Volume is so "quiet" now.
  5. I feel that chart pattern is very nicely setup.


Intraday Chart

clip_image001


Historical Chart

clip_image002

Wednesday, February 9, 2011

9th Feb 2011 - Pattern Study - XING , VHC , IBCP and TA

Ticker:


  1. XING, VHC, IBCP and TA


Topic:


  1. The magic of Fibonacci


Lesson Learnt:


  1. Patient is the key.
  2. "Fibonacci" your entry.
  3. 50%, 61.8% and 76.4% are quite common points for an entry.


Intraday Chart

-NA-

Historical Chart

clip_image001


clip_image002


clip_image003


clip_image004

9th Feb 2011 – Pattern Study - ABC

Ticker:


  1. ABC


Topic:


  1. Don't you think that trading should be as simple as ABC??!!


Lesson Learnt:


  1. Multiple bottom and up trend confirmation is all you need to make BIG bucks.
  2. This is how simple trading can be…. Sometimes.


Intraday Chart

-NA-

Historical Chart

clip_image001


9th Feb 2011 – Pattern Study - AONE

Ticker:


  1. AONE


Topic:


  1. Be patient and wait for your entry.


Lesson Learnt:


  1. I recorded this stock on 27th Jan 2011 and remind me to come back and check it out.
  2. Multiple support from all MA lines finally came in.
  3. Decide to get in seeing strong intraday activity.
  4. The symmetrical triangle is broken UP for the second time.
  5. Volume confirmation on-hand.


Intraday Chart

clip_image001


Historical Chart

clip_image002


clip_image003

Tuesday, February 8, 2011

7th Feb 2011 – My Analysis

Sorry for not posting anything for the entire last week. I was on Chinese New Year holiday and have totally no access line to the internet.

***Trust me!!! It is painful without internet connection***


BULL or BEAR ??


Short term (1 week)

Long term (6 months)

clip_image001

-- Company earning still encouraging.

-- Not much economy activity this week.

-- All the "correction" so far has been viewed as more chance to get in.

-- Do you really think that America stock market cares about Egypt in the short run?!

-- VXX chart dip lower again.

-- All sectors charts still remain healthy.

clip_image002

-- Instability in Egypt has caused oil to surge.

-- UUP is coming to the multiple bottom formation.

-- FXI is still in down trend


Next Week Economic Data:


clip_image003


Input:


  1. Do not expect much volatility this week.


VXX chart:


clip_image004


clip_image005


Input:


  1. Intraday VXX chart dip lower again. Looks like there is no end in sight yet.
  2. Last week "interesting spike" could have cheated many.


SPY chart:
 

clip_image006


Input:


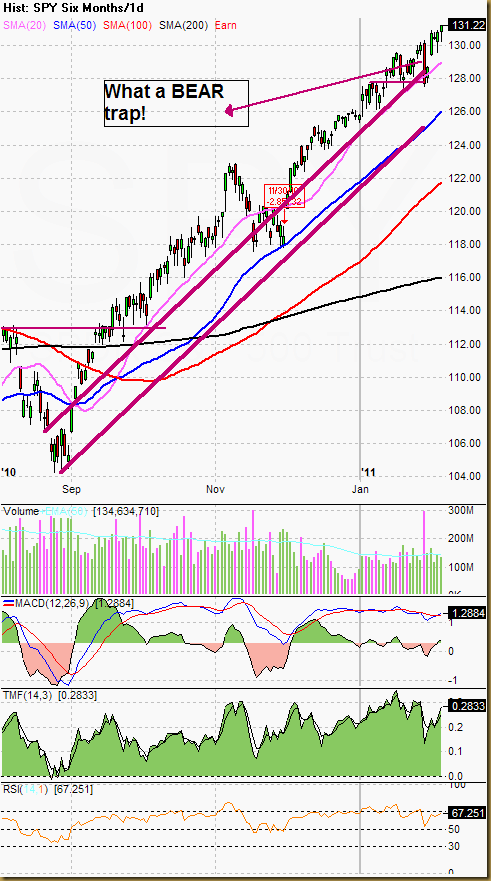
  1. The BEAR trap last week could have caught many by surprise.
  2. Be very careful of this kind of BEAT trap.
  3. Always get confirmation from DJIA and NASDAQ.


DJIA chart:


clip_image007


Input:


  1. You might get panicked by the "correction" of SPY, but DJIA tells us that everything should be alright.
  2. Always refer to the UUP chart also.


NASDAQ chart:


clip_image008


Input:


  1. The "correction" could have been triggered by NASDAQ when it came up from bottom to touch the trend line last Friday (before Chinese New Year).


UUP chart:


clip_image009


clip_image010


Input:


  1. Watch out for a "touch down" at weekly UUP chart at $22.00 which might give a correction to the market.
  2. However, this might take a week or more.


Sector Analysis:


clip_image011


Input:


  1. All sectors still look healthy. Only XLP is a  bit weaker.


GLD, SLV and Natural Gas charts:
 

clip_image012


clip_image013


clip_image014


Input:


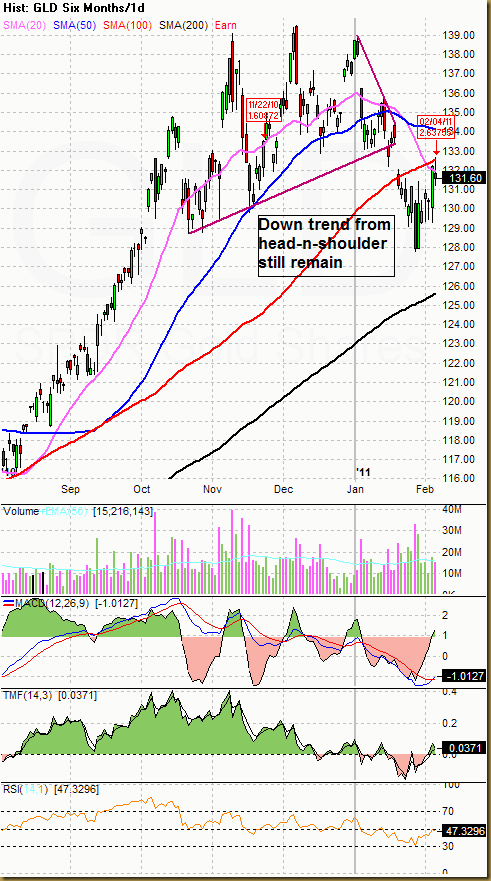
  1. GLD down trend from head-n-shoulder formation still remain.
  2. SLV came poke through the down trend line and came back up the 20MA and 50MA lines. Looks bullish, but might just be forming a right shoulder. RSI still weak.
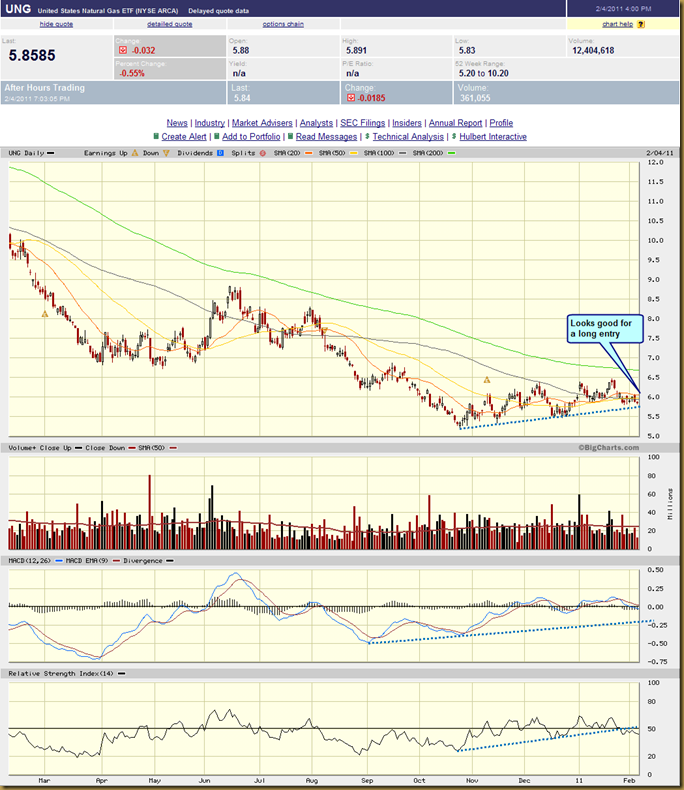
  3. UNG is coming back to the up trend line again. Looks good for a long entry if you have the patient and $$$.


FXI (iShares FTSE / Xinhua China 25 Index Fund) chart:
 

clip_image015


Input:


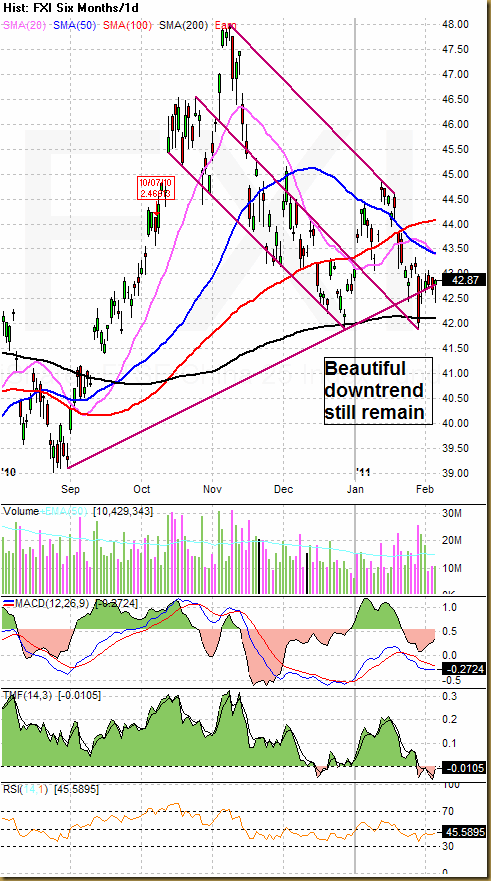
  1. FXI is still intact at the down trend.


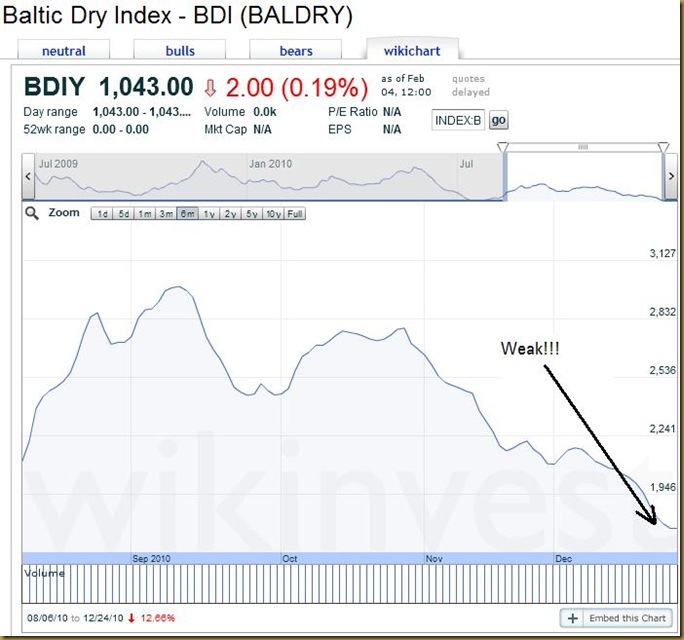
Baltic Dry Index chart:
 

clip_image016


Input:


  1. Weak… weak… weak !!!