BULL or BEAR ??
| Short term (1 week) | Long term (1 month) |
| 
-- All indexes have come to a long term multiple top formation. However, if all indexes broke up from their resistance lines, then we are going to have a very strong BULL. -- All indexes went up for the past weeks too fast and the volume is not that encouraging. -- Daily SPY chart seems to form an isolation island formation (BEARISH). -- UUP is at a critical stage with a very upside volume on May. Possibility of UUP going higher is quite high and that will be a bad news for the stock market. -- VXX is at it lowest low again. Intraday chart shows that it is at a critical junction. -- USO is back to its downtrend again after a fake breakout. -- FXI is still below its uptrend line. | ![clip_image001[1]](https://blogger.googleusercontent.com/img/b/R29vZ2xl/AVvXsEhL38qgCxCMhsVwk2rNNKbIEAnsyPu_SKAb_wZnLKGfZY4h_xGlsTJwDwo5fbNeDGiAQrN4Ueou5PuT-kOI42WTfH0JkwUUuNMyV7ZqPbHu8o52LOEQyK19TjNhs0ztBhcpq1HSdqUVRCo//?imgmax=800 "clip_image001[1]")
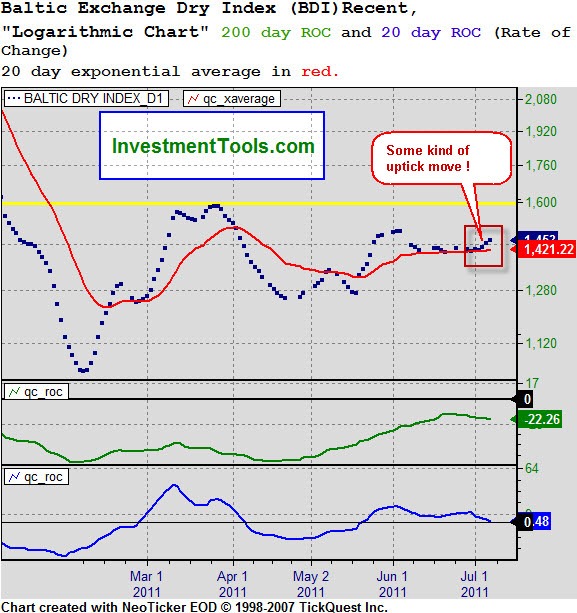
-- Except that all indexes break up from all their multiple top formation, else we could be reaching a long term top which can be dangerous. -- Baltic shows a bit of uptick, but not significant enough. Most shipping stocks are still been beaten down to earth. |
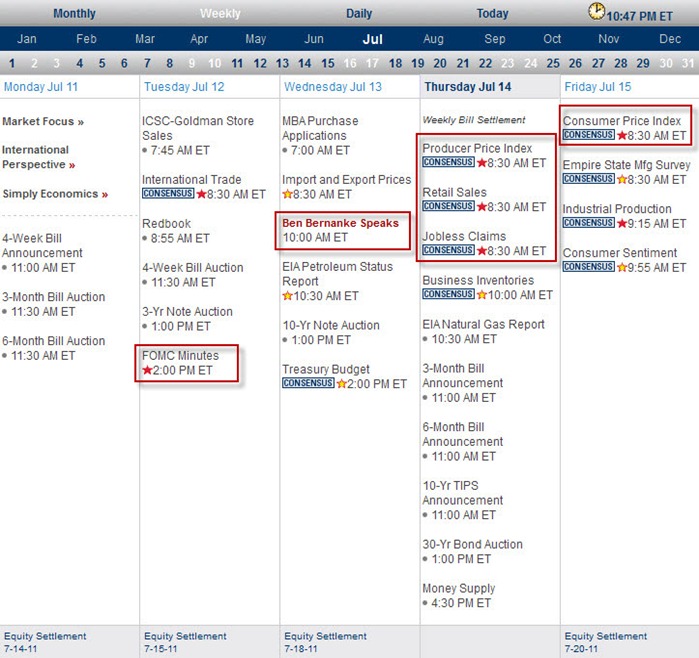
Next Week Economic Data:
Input:
- Heavy data week next week. CPI, PPI and Jobless claim all will be out.
- Ben speaks?? What can he do??
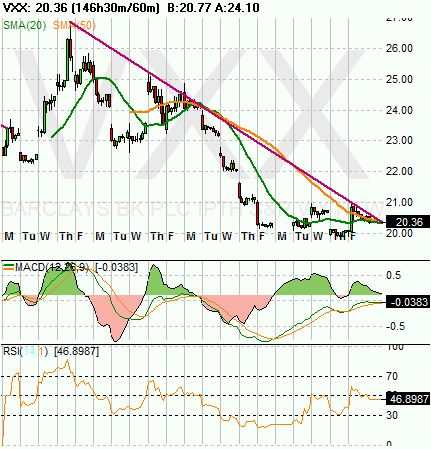
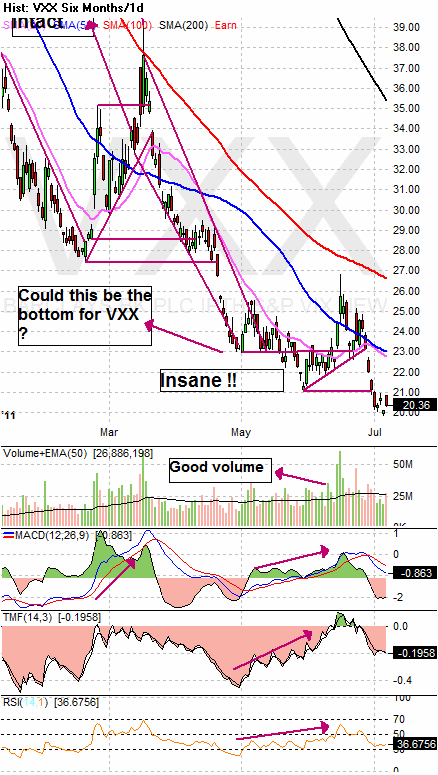
VXX chart:
Input:
- VXX continue to make lower low. This is an insane market.
- However, intraday VXX chart shows that it is at a critical junction.
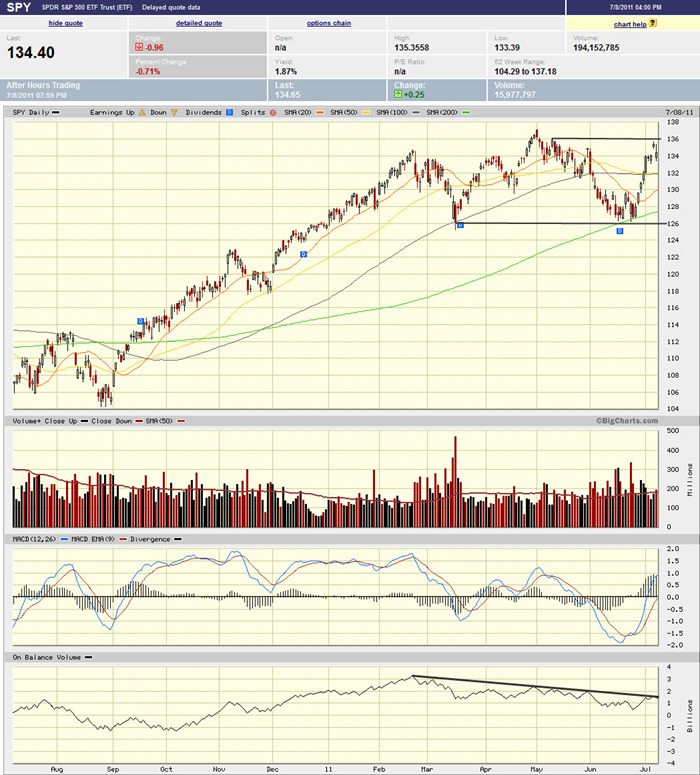
SPY chart:


Input:
- Look at the long term weekly chart, you will find that it is again following text book.
- A very possible of isolation formation (BEARISH) in SPY daily chart.
DJIA chart:
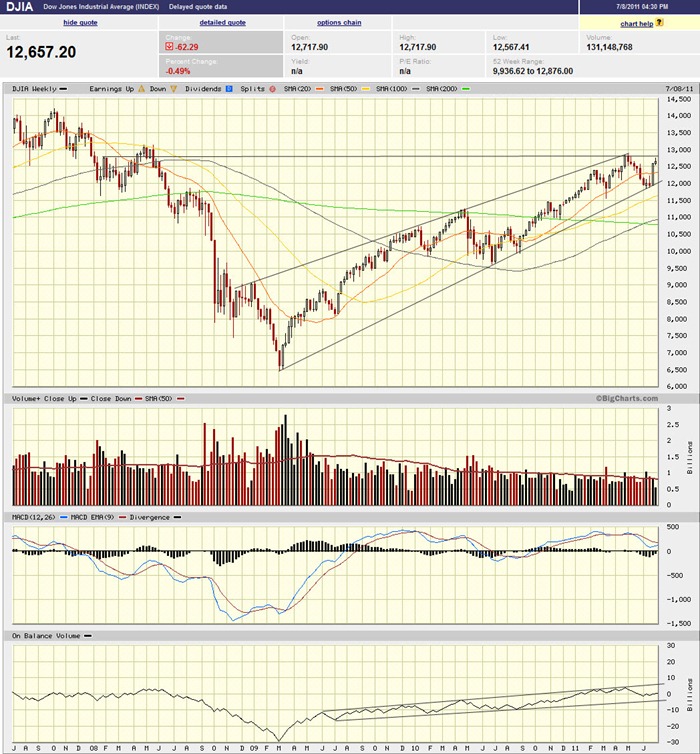
Input:
- It is a very fantastic long term DJIA chart. Everything just follow text book.
- Expecting at least a healthy correction at this point.
NASDAQ chart:
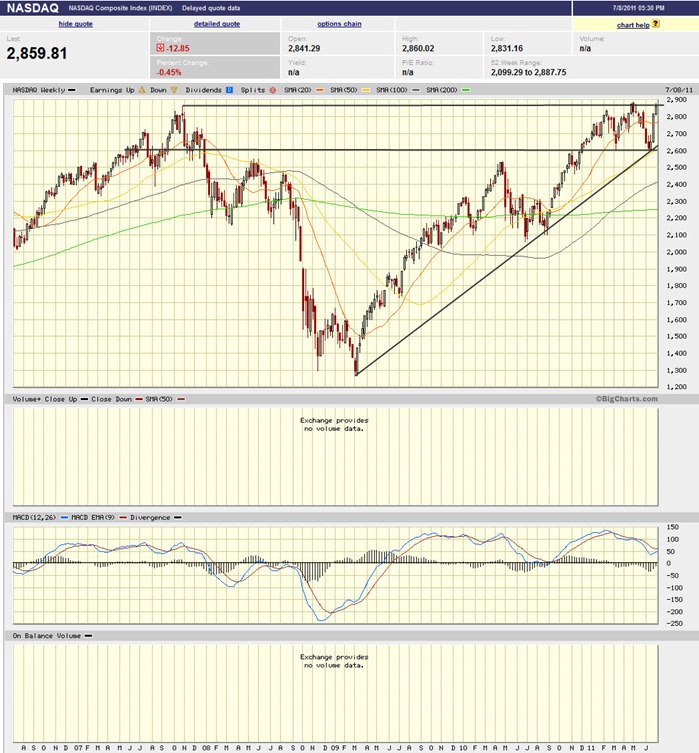
Input:
- It look like a triple top formation. The up is too quick too fast.
- Expecting a healthy correction from here.
UUP chart:

Input:
- UUP is at a critical stage. A turn to the upside is quite likely because of its upside volume on month of may.
- This can be a bad news for stock market.
Sector Analysis:
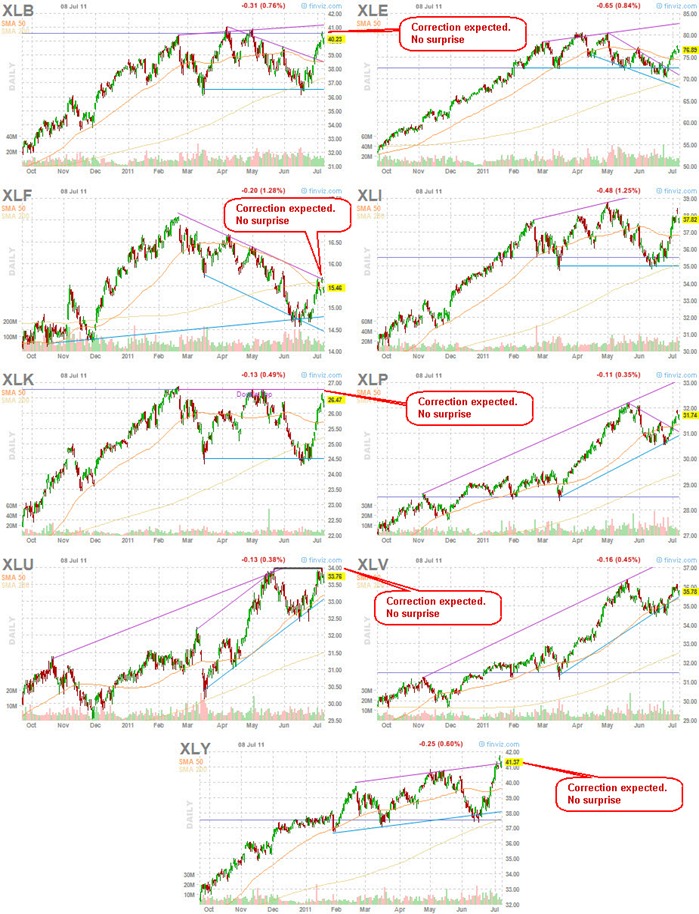
Input:
- Many sectors reached their multiple top, so correction is not a surprise.
GLD, SLV, Petrol and Natural Gas charts:
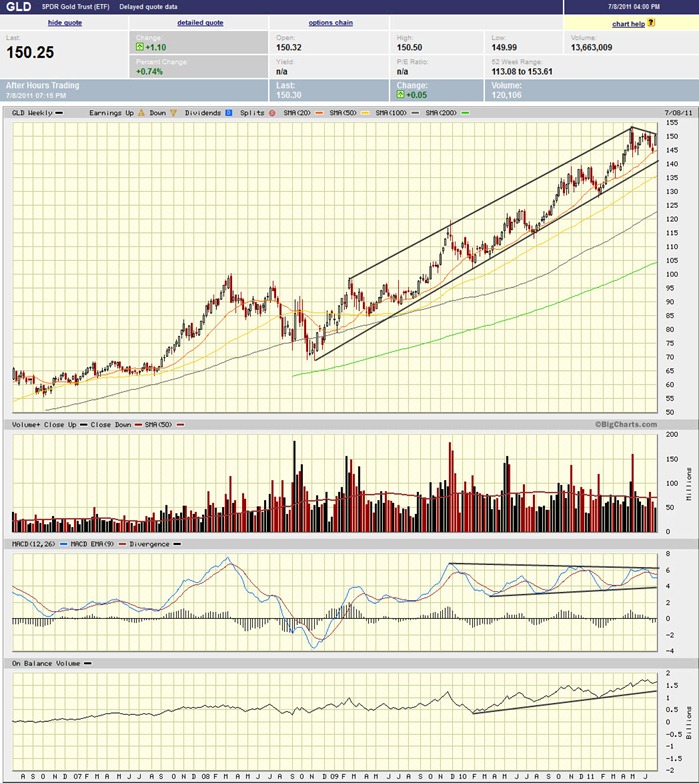


Input:
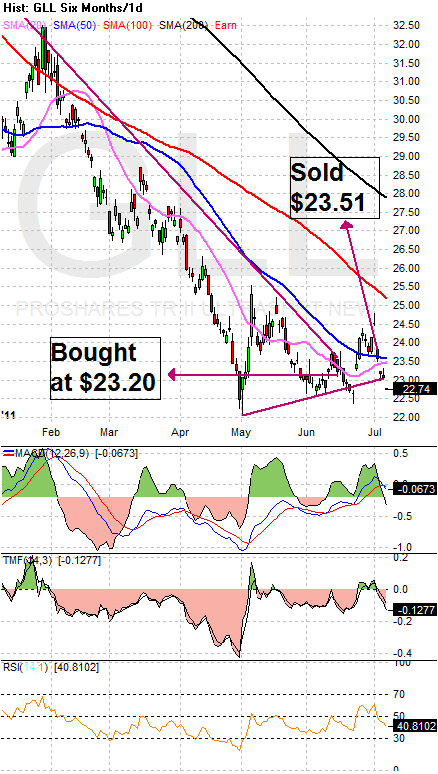
- Looks like GLD is still in its uptrend. GLL is broken down from its uptrend line again.
- Silver is now in a tight range play and approaching the 20MA line which now acts as resistance line. Low volume may not be able to sustain its up move. A chance to short silver could be very near now.
- Looks like the down trend of USO is still intact. That sounds like a bad news for the economy growth.
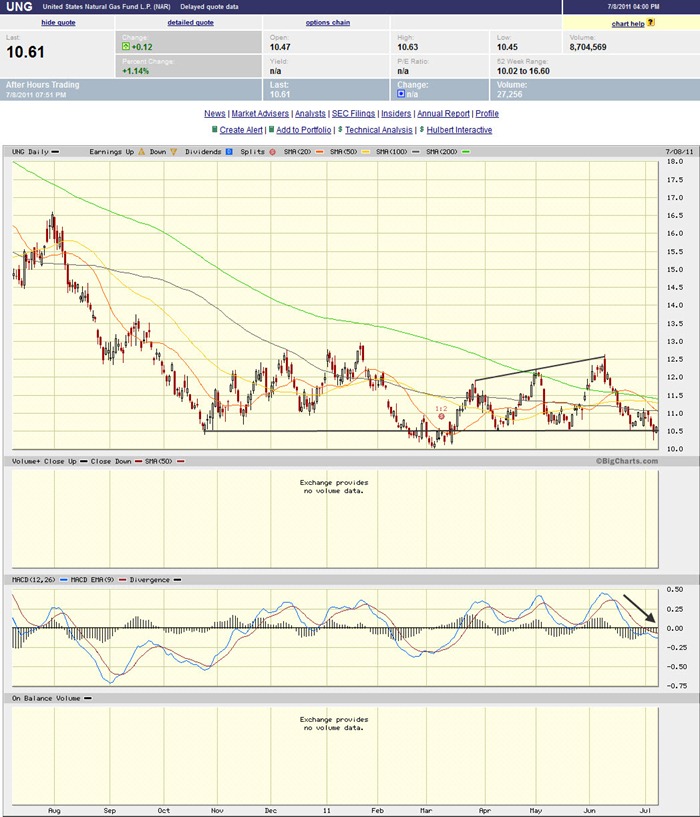
- With the USO in the downtrend, UNG won't be in much of a good shape.
- UNG is doing a multiple bottom formation for its long term chart, but it looks weak rather than an opportunity. All its MA lines are acting as resistance line.
FXI (iShares FTSE / Xinhua China 25 Index Fund) chart:
Input:
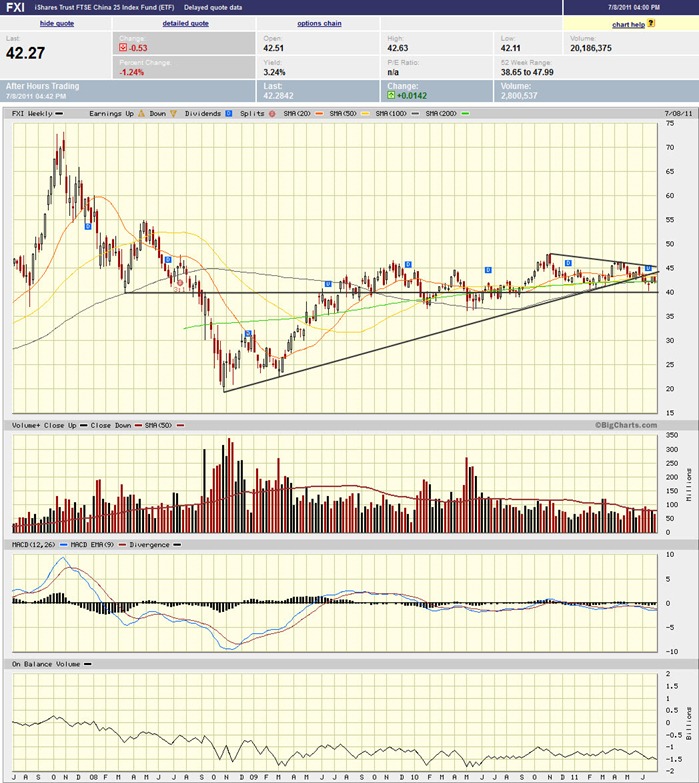
- FXI is sitting on its 100MA and 200MA lines which it previously punch through downward.
- The long term FXI chart shows that the downtrend is still intact.
- MACD shows that it has not been able to go up from its 0 line for one and a half year already.
Baltic Dry Index chart:
Input:
- Don’t rush into shipping stock yet. Many of them are almost dead.


![clip_image001[1]](https://blogger.googleusercontent.com/img/b/R29vZ2xl/AVvXsEitjVg68yn42N2v3Xidz6ZdF5WPCATUZTi0QtK_NYccQFxNMVKW7skuc1aRKD3sYSQlQFYakt245LbdrnT0CFIZSuPRDKjkqDBDR73o2T28_Uxn0t1sEkssKr_I9fjUoE9FLOXn4Sophu4/s1600-h/clip_image001%25255B1%25255D%25255B2%25255D.jpg "clip_image001[1]")


