Friday, April 22, 2011

22nd-April-2011–Pattern Study–Control… JetBlue request for landing

Ticker:Temp


  1. JBLU


Topic:


  1. Jet Blue Airway is not flying.
  2. Zig-zag confusing chart pattern.


Lesson Learnt:


  1. Intraday price is heavily blocked by trend line.
  2. Daily chart shows strong resistance at the trend line. Price now below  all MA lines.
  3. Yesterday daily chart shows that it break down from the support line even the open is high.
  4. Weekly chart shows zig-zag chart pattern. Hard to trade. Price is also below all MA lines with no clear support line.
  5. No good reason to go long for this stock. In fact, it looks more like good to short now.
  6. Petrol is also going higher now. This will be bad for airlines.


Intraday Chart

clip_image001


Historical Chart

clip_image002


clip_image003

Thursday, April 21, 2011

21st-April-2011–Pattern Study–Can we predict the rally of 200 points in DJIA yesterday ?

Ticker:


  1. VXX


Topic:


  1. Can the 200 points of rally in DJIA yesterday be predicted. Answer is === YES !!! But you really have to look very closely all the tiny bits and looks from other ticker rather than on DJIA itself.


Lesson Learnt:


  1. On Monday, DJIA had a 250 points BIG drop in a day. Look what is the response of VXX! It does gap up, but at the end of the day if came almost all the way down. This is really weird behavior and it has indicated that a BIG BULL is now at the back.
  2. DJIA  collected more energy on Tuesday.


Intraday Chart

clip_image001


clip_image002


Historical Chart

-NA-

21th-April-2011–Pattern Study–ATML

Ticker:


  1. ATML


Topic:


  1. Flag pattern


Lesson Learnt:


  1. This is a strong stock, it gather a lot of energy at the flag pattern.
  2. Looks like I won the bet from my friend for RM50.00          ;-)
  3. Many strong stock follow this pattern if you observe closely. It will be bring you fortune if you managed to get many of such counter.


Intraday Chart

clip_image001


Historical Chart

clip_image002


Wednesday, April 20, 2011

20th-April-2011–Pattern Study–RDN

Ticker:


  1. RDN


Topic:


  1. Another big mountain kind of chart -- The Himalaya Mountain chart.
  2. The price will tank just with the weight on top of it.


Lesson Learnt:


  1. If short was actually taken in this case. It is really important to control the emotion when the price gap up the next day. Stay cool and see how thing react might be a wiser choice.
  2. In addition tonight DJIA gap > 150 points before market open. So such a bullishness will easily sway my emotion and run for cover.
  3. This case has again prove the importance of chart pattern recognition.


Intraday Chart

clip_image001


Historical Chart

clip_image002

Tuesday, April 19, 2011

19th-April-2011–Pattern Study–The crocodile is here this time.

Ticker:Temp


  1. CROX


Topic:


  1. The crocodile is coming for real.
  2. Poking through resistance line for the 3rd time.


Lesson Learnt:


  1. This is the 3rd time poking up from the resistance line.
  2. At daily chart, you can see that it did that in two stages. This time it is coming for rea.


Intraday Chart

clip_image001


Historical Chart

clip_image002

19th-April-2011–Pattern Study–DANG

Ticker:


  1. DANG


Topic:


  1. I told my gym friends on Monday lunch time while walking at the car park after the gym session about this counter.
  2. Today is Tuesday.
  3. Multiple bottom formation.


Lesson Learnt:


  1. Multiple bottom at daily and weekly chart.
  2. If you have not get in on Monday, all you can say now is maybe …….  "DANG it !! I should have listen."


Intraday Chart

clip_image001

Historical Chart

clip_image002


clip_image003

18th-April-2011–Pack some Chinese cooking on the way home!

Buy $

Sell $

Sell Short $

Buy Back $

Stop Loss $

Profit / Losses

Duration

18.00


16.09


Reason for Buy / Sell / Sell Short / Buy Back:


  1. Daily and weekly charts show that price has punched through the upper trend line.
  2. Daily chart is now above 20MA line.
  3. MACD and RSI are indicating positive climb.
  4. Intraday suddenly shows strong buying interest.


Lesson Learnt:


  1. It is Friday when I made this purchase, there could be quite a number of sellers standing at the side waiting to sell. So I set at $18.00 and managed to get it, instead of chasing the price much higher.


Intraday Chart

clip_image001


Historical Chart

clip_image002


clip_image003

Monday, April 18, 2011

18th-April-2011–Getting off from the dragon.

Buy $

Sell $

Sell Short $

Buy Back $

Stop Loss $

Profit / Losses

Duration


41.00


Nice cup of coffee

10 Days


Reason for Buy / Sell / Sell Short / Buy Back:


  1. All 3 indexes have successfully rebounded from their daily chart of 50MA and 20MA lines. Same for their intraday charts.
  2. FAZ intraday has started to get weak and began to sit on the 20MA line.
  3. C, BAC and GS are starting to came down to their support lines.
  4. VXX is again at double bottom and it looks like more potential for it do go lower rather than rebound.


Lesson Learnt:


  1. Let's take some profit from the table first for FAZ. This dragon is pretty hard to handle anyway.


Intraday Chart

clip_image001


clip_image002


clip_image003

Historical Chart

clip_image004


clip_image005

18th-April-2011–My Analysis

BULL or BEAR ??


Short term (1 week)

Long term (1 month)

clip_image001

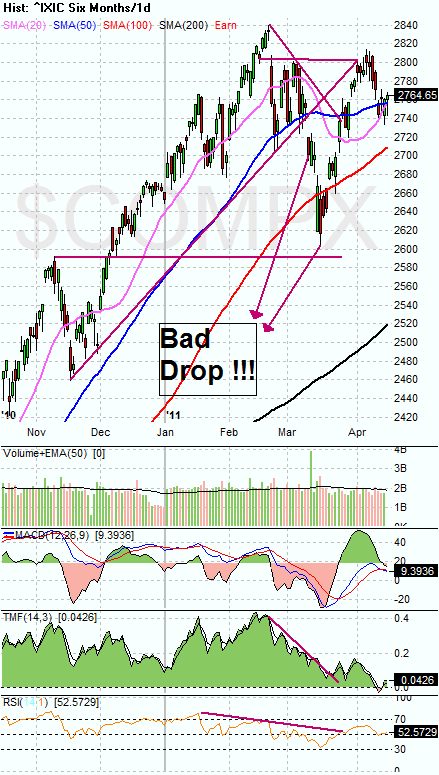
-- All 3 indexes have rebounded from their 50MA and 20MA lines. This is temporary bullish.

-- VXX has came down to the double bottom, its lowest point so far and it can get even lower.

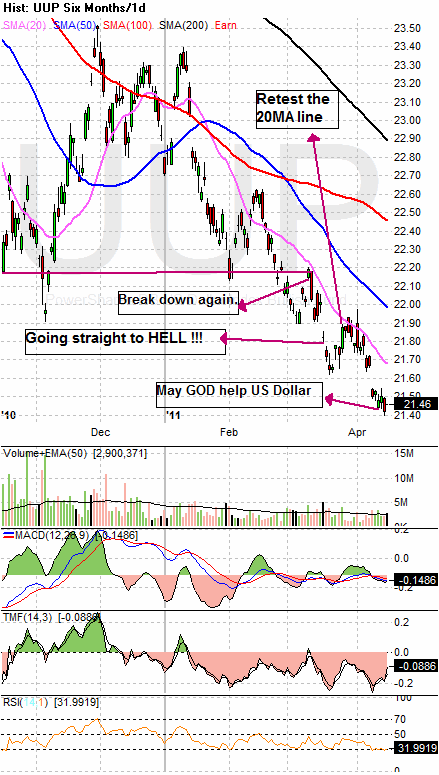
-- UUP is at all time low.

clip_image002

-- This rebound of 3 indexes can be just temporary.

-- VXX might rebound from its lowest point and if it does, it can be volatile.

-- The QE2 is going to end at June. This can be havoc.

-- The US debt issue is again on the focus.

-- Japan and Libya issues are not yet settled.

-- "Sell in May, Go Away…" Remembered?


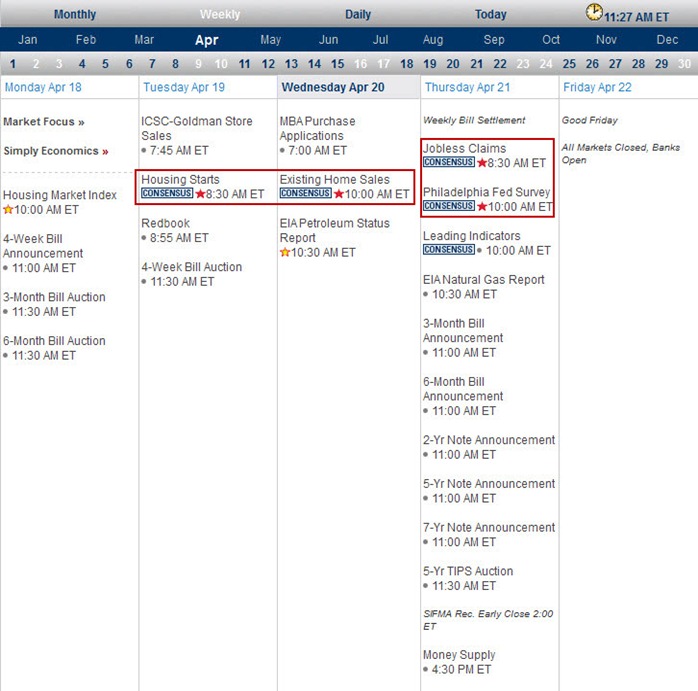
Next Week Economic Data:


clip_image003


Input:


  1. Only housing data and Jobless claim on next week data release.
  2. Market should not be too volatile.


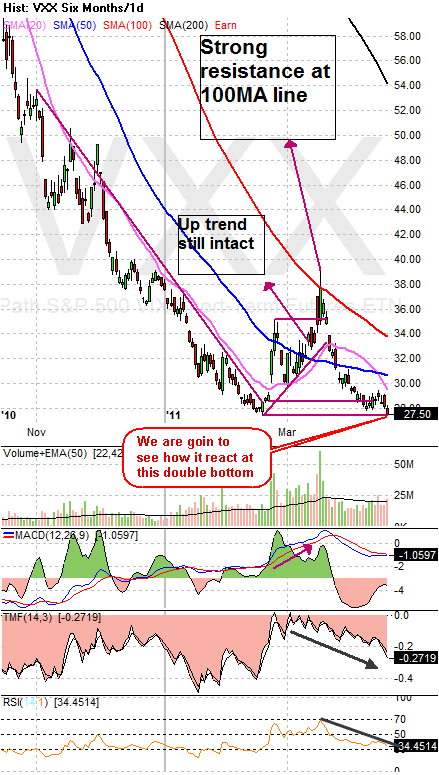
VXX chart:


clip_image004


clip_image005


Input:


  1. VXX is again coming to the double bottom. It is again at a critical point. We will watch closely how it behaves from here,.
  2. VXX has potential to get even lower from here, so if you are shorting stocks, it is wise to tighten your stop loss now.


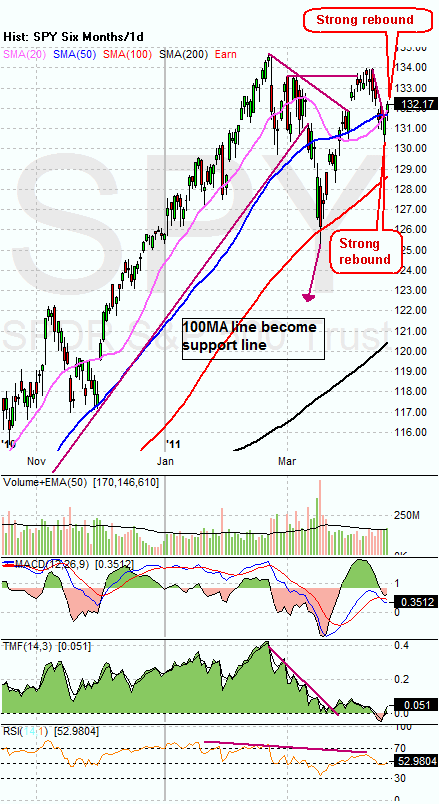
SPY chart:
 

clip_image006


clip_image007


Input:


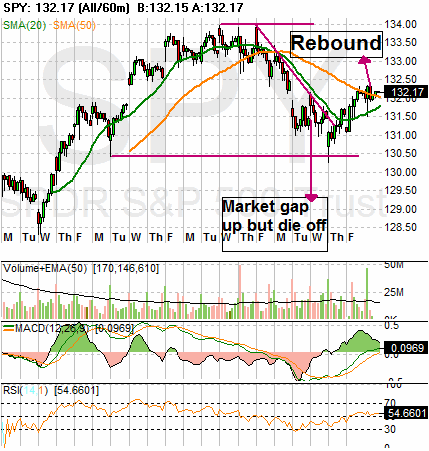
  1. SPY has gave two days of strong rebound if you observed carefully.
  2. Right now it has just brake through the daily trend line going upwards.
  3. Daily 20MA line is bullish crossing the 50MA line again.
  4. This rebound can be short live, but we will see.


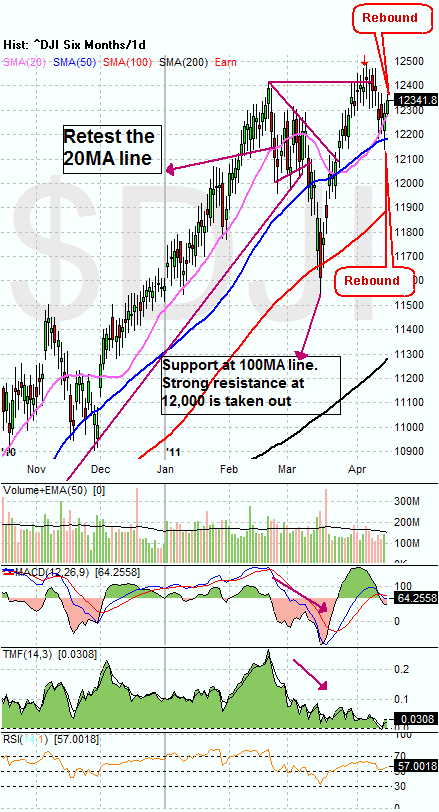
DJIA chart:
 

clip_image008


clip_image009


Input:


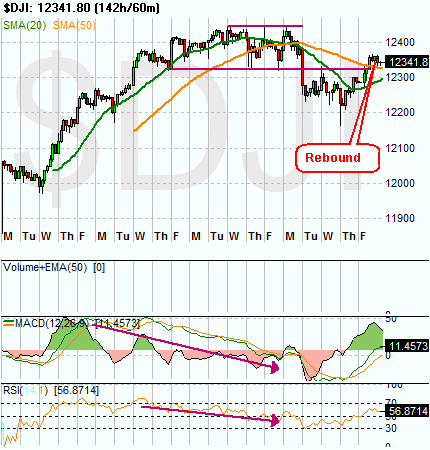
  1. Intraday go above 50MA line already. This is bullish indicator for DJIA.
  2. Daily chart rebound from the 50MA and then 20MA line shows that bulls are back (at least for now).
  3. Behave similar to SPY.


NASDAQ chart:


clip_image010


clip_image011


Input:


  1. NASDAQ remain the weakest of all three indexes. Its intraday chart still below 50MA line but managed to get up from 20MA line.
  2. Daily chart however shows that it has also manage to rebound from the 50MA and 20MA lines. This is also a bullish indication.


UUP chart:
 

clip_image012


Input:


  1. USD is basically hopeless.        ;-)


Sector Analysis:


clip_image013


Input:


  1. You can see clearly all the charts that was pointed with black arrow. Those are the sectors that are now touching the lower part of the trend line.
  2. XLP and XLV are the only two sectors that are really strong.


GLD, SLV, Petrol and Natural Gas charts:
 

clip_image014


clip_image015


clip_image016


clip_image017


Input:


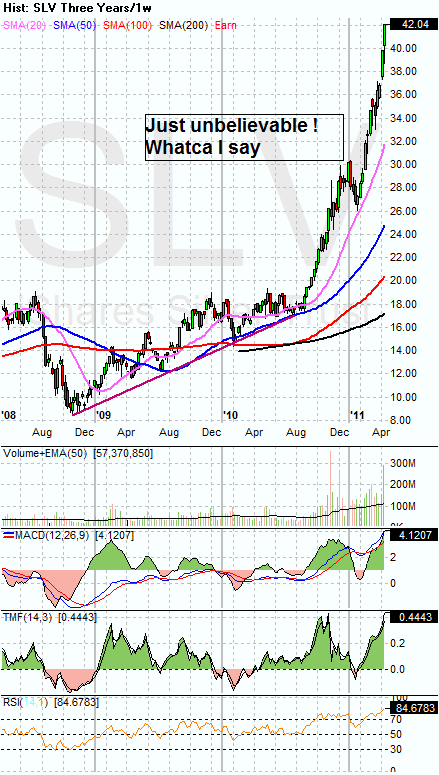
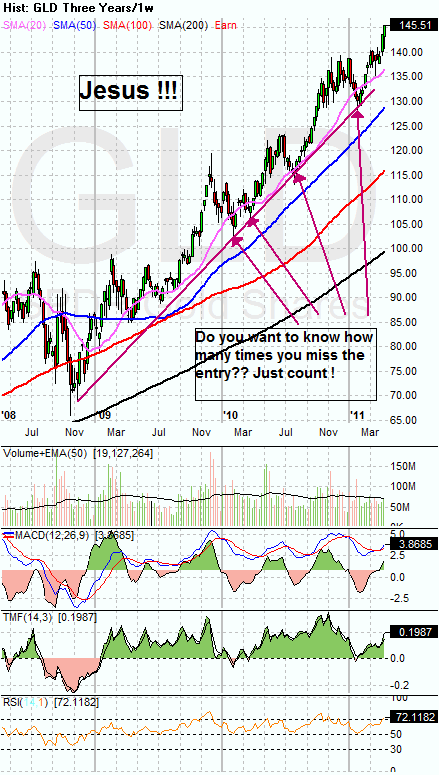
  1. If you buy GLD and SLV…. You are definitely rich by now. The charts tell it all.
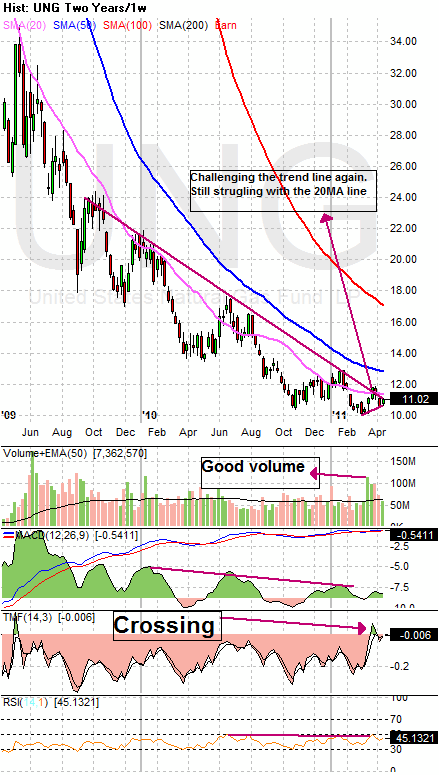
  2. The natural gas is behaving ok.
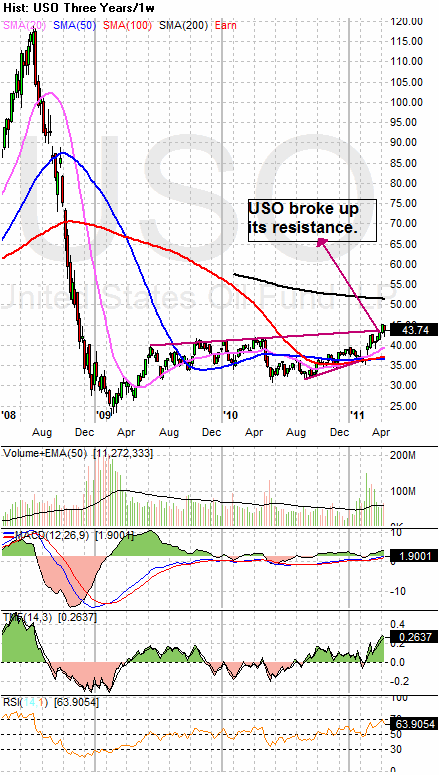
  3. USO is consolidating at the upper trend line. It has more potential to go upward rather then downward.


FXI (iShares FTSE / Xinhua China 25 Index Fund) chart:
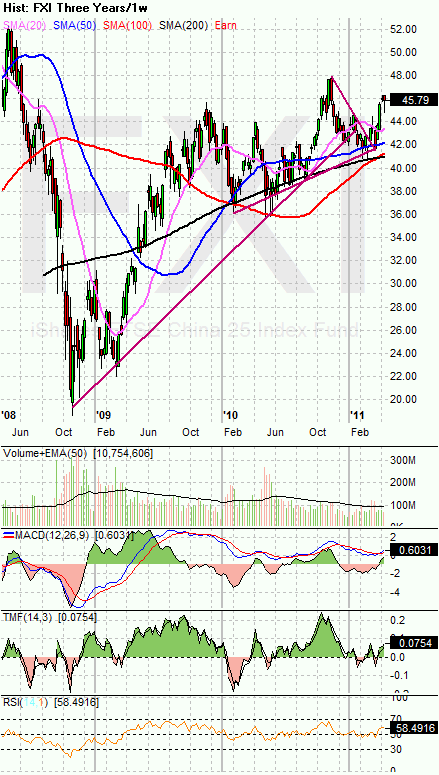
 

clip_image018


Input:


  1. China index still remain very healthy.


Baltic Dry Index chart:


Input:


  1. Not much different from last week. So I am not showing it here this week.