Tuesday, November 8, 2011

08th Nov 2011–Fun but dangerous!

Buy $

Sell $

Sell Short $

Buy Back $

Stop Loss $

Profit / Losses

Duration


325.76


Even

9 days


Reason for Buy / Sell / Sell Short / Buy Back:


  1. Market start to rally and AZO keep rebound back every time it poke through $324.00.
  2. Intraday 18MA and 47MA lines are going to do bullish cross.
  3. Daily chart shows that it is trying to challenge the 18MA resistant line again. It might not succeed, but anyway, let's get out and see how it react to it.


Lesson Learnt:


  1. This is a strong stock. Shorting it is never easy.     ;-)


Intraday Chart

clip_image001


Historical Chart

clip_image002


08th Nov 2011–Gold trap !

Buy $

Sell $

Sell Short $

Buy Back $

Stop Loss $

Profit / Losses

Duration


15.62


loss


2 days


imagesReason for Buy / Sell / Sell Short / Buy Back:


  1. GLD gapped up even though indexes went down.
  2. The world is now expecting to print $$ to save Europe. The easing mind set is on again.


Lesson Learnt:


  1. Sometimes you don't have to wait for your stop loss to hit.
  2. GLD might go even higher from here.


Intraday Chart

clip_image001


Historical Chart

clip_image002

Monday, November 7, 2011

07th Nov 2011–My Analysis

BULL or BEAR ??


Short term (1 week)

Notes

clip_image001

-- All three indexes are still showing Bull's signature.
-- Europe problem seems like an opportunity for buying. Just some funny easing policy is cheer by market.

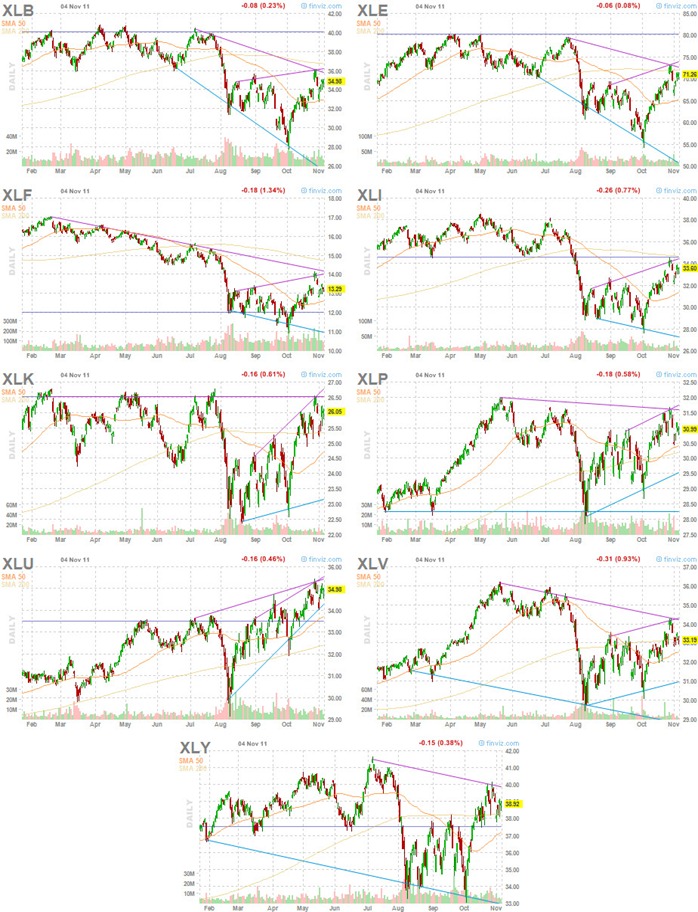
-- All sectors reached resistance line and do minor correction.

-- UUP uptrend is facing challenges.


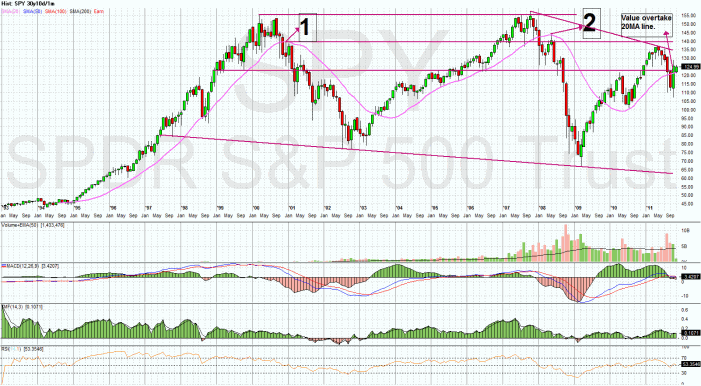
SPY (30 years monthly) chart:


clip_image002


Input:


  1. SPY 30 year chart still stay healthy.
  2. Value is still above the 20MA line and the support trend line.
  3. We still have to accept that bulls are still in control.


Next Week Economic Data (1 week):


clip_image003


Input:


  1. Not much data report for the week. The news will be basically all those Europe debt news.


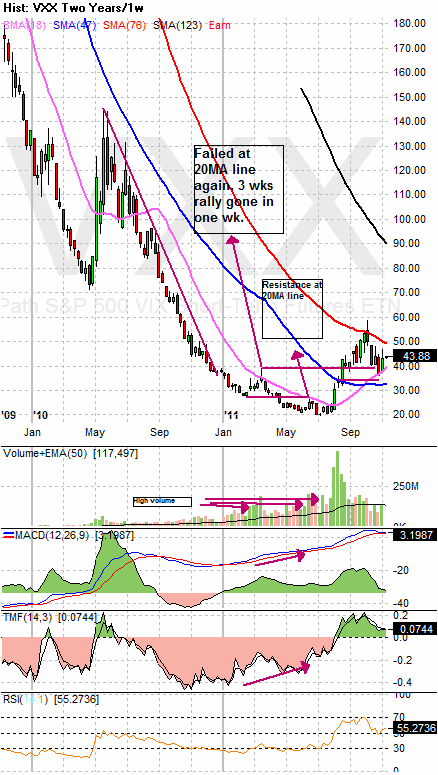
VXX chart:


clip_image004


clip_image005


Input:


  1. Both daily and weekly VXX charts show that it still has support from 18MA line.


SPY chart:
 

clip_image006


Input:


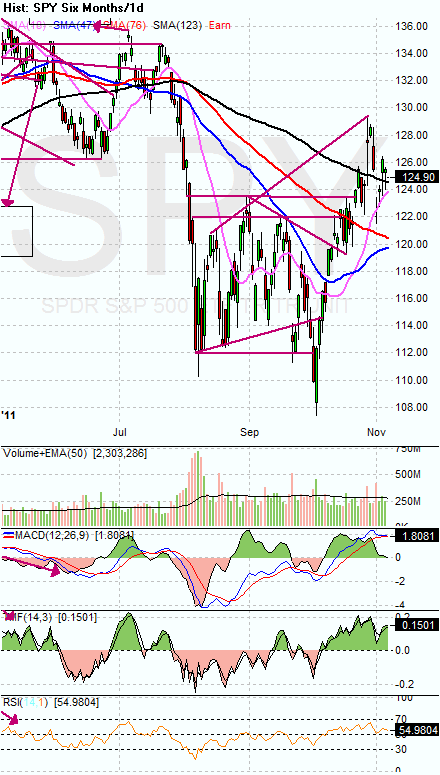
  1. Daily SPY still has support from 123MA and 18MA lines.
  2. Bull still has the control.


DJIA chart:


clip_image007


Input:


  1. Similar to SPY, daily DJIA has strong support from 18MA and 123MA lines.
  2. Golden cross is forming for 18MA and 123MA line.


NASDAQ chart:
 

clip_image008


Input:


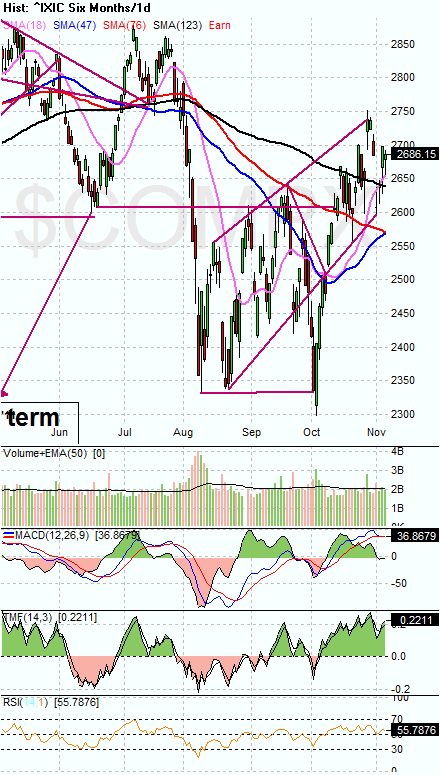
  1. Similar to SPY and DJIA, strong support from both 18MA and 123MA lines.
  2. Golden cross for 18MA and 123MA lines completed.
  3. Bull has the upper hand.


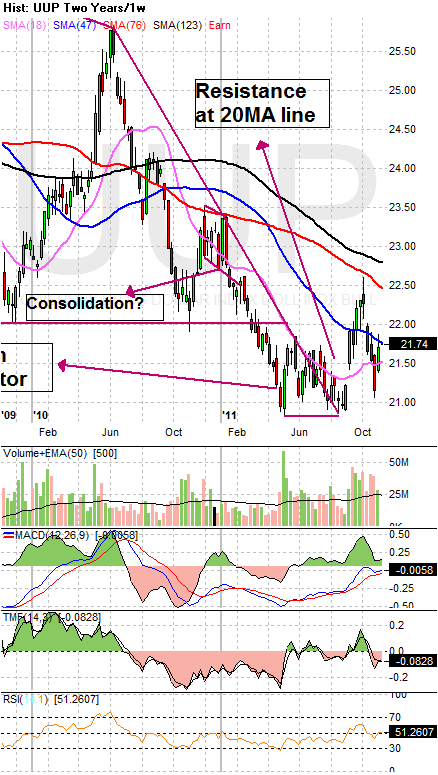
UUP chart:


clip_image009


Input:


  1. UUP uptrend is weak but not completely dead yet.


Sector Analysis:
 

clip_image010


Input:


  1. All sectors touched their resistance lines and now in minor correction mode.


Copper JJC  chart:
 

clip_image011


Input:


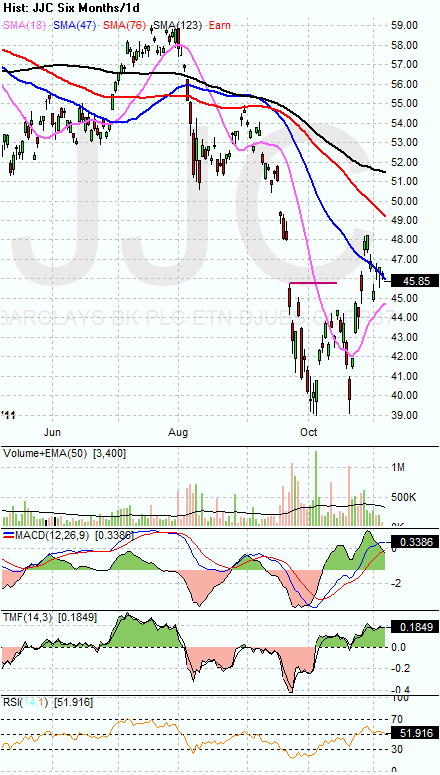
  1. JJC chart facing resistance at 47MA line.


GLD and SLV charts:
 

clip_image012


clip_image013


Input:


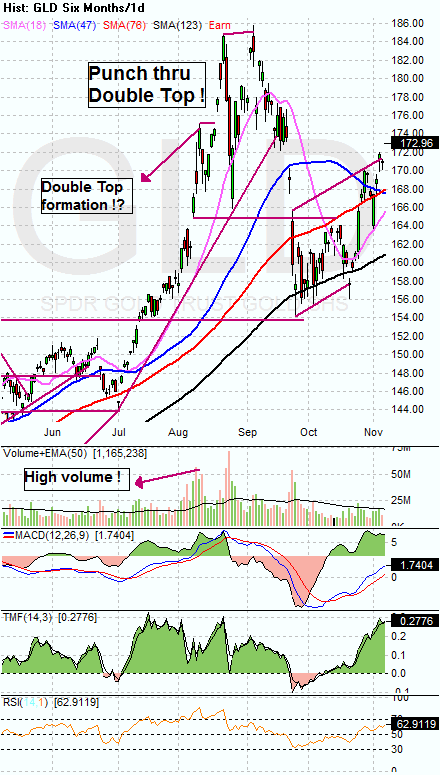
  1. GLD is tremendously strong. Looks like some kind of easing policy is going to implement for the Europe problem.
  2. SLV is following GLD's move, but facing resistance at 47MA line.


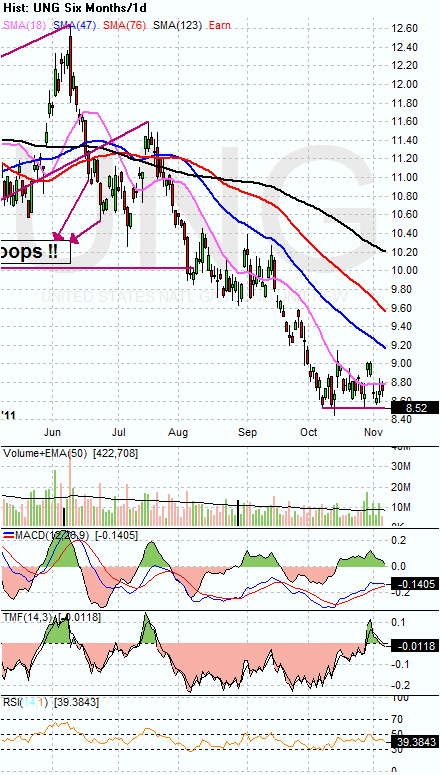
 Petrol and Natural Gas charts:
 

clip_image014


clip_image015

Input:


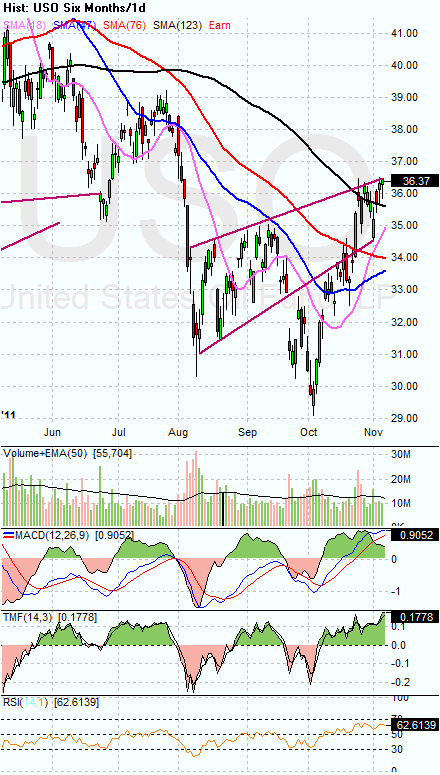
  1. USO facing resistance at trendline.UNG is again doing its all time low multiple bottom again. Anyone dare to go near?


FXI (iShares FTSE / Xinhua China 25 Index Fund) chart:
 

clip_image016


Input:


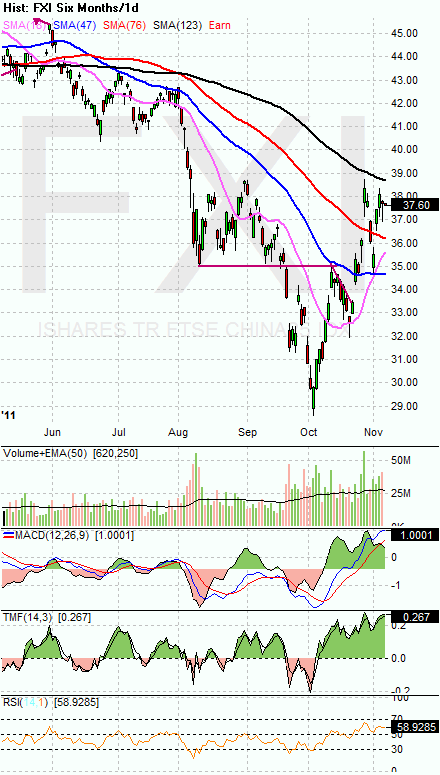
  1. FXI is facing resistance at 123MA but still has support from 76MA line.


Baltic Dry Index chart:
 

clip_image017


Input:


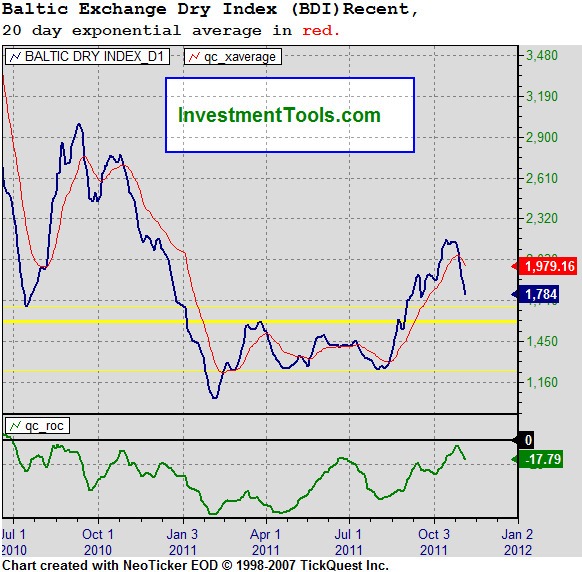
  1. Shipping turn South suddenly. A very sudden and interesting turn. What does it mean to the market?

Saturday, November 5, 2011

05th Nov 2011–We sell GoLD !

Buy $

Sell $

Sell Short $

Buy Back $

Stop Loss $

Profit / Losses

Duration

16.10


15.10


Reason for Buy / Sell / Sell Short / Buy Back:


  1. Daily chart shows that GLL hit the bottom part of trend line.
  2. Daily chart of GLD shows that it hit on the upper part of trend line.


Lesson Learnt:


  1. Entry point sucks. I should have know that GLD is still strong and I should have waited for my entry patiently.
  2. This is quite a dangerous take.


Intraday Chart

clip_image001


Historical Chart

clip_image002


clip_image003

05th Nov 2011–JaVA coffee… anyone?!

Buy $

Sell $

Sell Short $

Buy Back $

Stop Loss $

Profit / Losses

Duration

10.10


9.44


imagesReason for Buy / Sell / Sell Short / Buy Back:


  1. Intraday chart shows that it has started to break the down trend line and try to go higher, but came back down and do multiple bottom at around $9.50 to $10.00.
  2. Daily chart shows that it has just started broken the long 4 months downtrend line.
  3. Daily chart also shows some kind of very nice U shape cup with handle.
  4. Daily chart also shows that price seems to find support at Fibonacci level of 61.8%.
  5. Long term weekly chart also shows that it seems to find support at 47MA line.


Lesson Learnt:


  1. I did the 1st purchase (40% of total ) at $10.00. Immediately after purchase, price shot up quickly.
  2. I set another purchase (60% of total) at $10.10. The price was captured about an hour later.
  3. Things to watch out for is daily chart shows that it is still below all MA lines and weekly chart MACD is still not pretty.
  4. Daily volume went up above average on second day of purchase which is good sign.


Intraday Chart

clip_image001


Historical Chart

clip_image002


clip_image003

Thursday, November 3, 2011

03rd Nov 2011–A stupid stop loss cost me GoLD.

Buy $

Sell $

Sell Short $

Buy Back $

Stop Loss $

Profit / Losses

Duration


164.00


Reason for Buy / Sell / Sell Short / Buy Back:


  1. Stop loss triggered immediately after the market opened.


Lesson Learnt:


  1. This is a very stupid stop loss point that I have set. I should know better. 50% of profit gone just because of a careless stop loss strategy.
  2. It bounce all the way back in just two quick days. Amazing Gold!!!
  3. This is the adding point, NOT the stop loss point.
  4. Now the problem is how to get it back.


Intraday Chart

clip_image001


Historical Chart

clip_image002