Wednesday, May 4, 2011

4th May 2011–Be cool YOKU, I will be back!

Buy $

Sell $

Sell Short $

Buy Back $

Stop Loss $

Profit / Losses

Duration


56.55 (Half)


Profit

2 Months & 3 weeks


Reason for Buy / Sell / Sell Short / Buy Back:yoku


  1. Sell half of my position in this strong lovely stock.
  2. Up trend on weekly and daily charts all broken. This is the fist time I saw this for this stock since I held it.
  3. Uptrend line at intraday also broken.


Lesson Learnt:


  1. If I have listened to the chart carefully, I could have let go half at the range of $60.00 - $62.00. Look carefully at the daily and intraday charts. Is has already warned you.
  2. Follow this stock carefully for next entry. This can be the stock of the century for my first pot of gold.
  3. Next interesting point will be $50.00


Intraday Chart

clip_image001


Historical Chart

clip_image002


clip_image003

4th May 2011–It is time to PAY tuition fees again!

Buy $

Sell $

Sell Short $

Buy Back $

Stop Loss $

Profit / Losses

Duration


51.11


Loss

7 days


Reason for Buy / Sell / Sell Short / Buy Back:


  1. Cut loss triggered.


Lesson Learnt:


  1. It actually went down till $49.00.
  2. My stop loss is somewhere below the 50MA line. So if it still breaks through, all stop loss rules have to be executed.
  3. The drop was very fast, I don’t even have chance to try to sell earlier than before it strike my stop loss.
  4. Intraday support line of course broken.


Intraday Chart

clip_image001


Historical Chart

clip_image002

Tuesday, May 3, 2011

3rd May 2011–Pattern Study # Can you still stay silver lining in SLV?#

Buy $

Sell $

Sell Short $

Buy Back $

Stop Loss $

Profit / Losses

Duration


Reason for Buy / Sell / Sell Short / Buy Back:


  1. Wanted to take LONG at ZSL, but missed it.


Lesson Learnt:


  1. I was watching it but I did not take a good action.
  2. I was it gapped down at opening. Waited for it to bounce back to $46.00. Set the purchase price for ZSL to $13.90 because I thought SLV might bounce back all the way back to $47.00.
  3. When SLV started to turn, I did not change and take my shot immediately on ZSL.
  4. Wasted almost 15% of profit in a night.
  5. Watch carefully, opportunity might still comes back (either long or short).


Intraday Chart

clip_image001


clip_image002


Historical Chart

clip_image003


clip_image004

3rd May 2011–Living with crocodile for 3 years.

Buy $

Sell $

Sell Short $

Buy Back $

Stop Loss $

Profit / Losses

Duration


20.50


Profit

3 years


Reason for Buy / Sell / Sell Short / Buy Back:crox


  1. Earning released, stock gap down.
  2. I have been living with crocodile for 3 years and learnt the entire stock cycle from it.


Lesson Learnt:


  1. This shows how important stop loss is to traders (read back my previous CROX post).
  2. The stock looks more like a SHORT candidate now.
  3. Let's see whether it will come back to $19.50 or not and see how it react there.


Intraday Chart

clip_image001


Historical Chart

clip_image002

Sunday, May 1, 2011

1st-May-2011–Pattern Study C, BAC, GS, WFC, UBS, FAS and FAZ

Ticker:


  1. C, BAC, GS, WFC, UBS, FAS, FAZ


Topic:


  1. If you refer back to the post http://stockaki.blogspot.com/2011/03/30th-march-2011pattern-studyc-bac-and.html, the prediction on the banks are somehow right on path
  2. Now


Lesson Learnt:


  1. FAS is forming a triangle. Need to decide where it will go first. Same goes for C.
  2. FAZ is coming down to test its support trend line.
  3. UBS form a double top pattern, however this stock looks most bullish among all.
  4. BAS looks really weak. Now testing its support line $12.30.
  5. GS looks even worse, broken down from the triangle that it formed. Also below all its MA lines. Looks more like a shorting opportunity.
  6. WFC is the one that look much more healthier with the support now at 50MA line at $28.60
  7. Monday might gives us indication whether we should go LONG or SHORT financial stocks.


Intraday Chart

clip_image001


Historical Chart

clip_image002


clip_image003


clip_image004


clip_image005


clip_image006


clip_image007


clip_image008


clip_image009

1st-May-2011–My Analysis

BULL or BEAR ??


Short term (1 week)

Long term (1 month)

clip_image001

-- Not much data coming out next week.

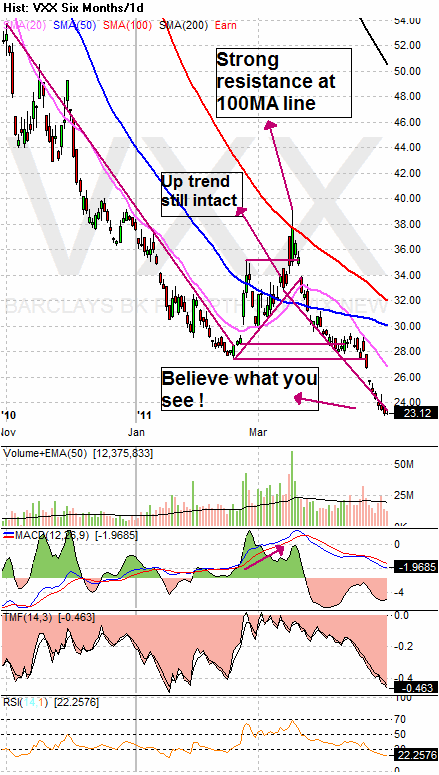
-- VXX chart still all time low.

-- No indication that indexes are resting. SPY and DJIA still has some room before the next resistance line. NASDAQ is even better, just take out its resistance line. Watch out for DJIA 13000.

-- UUP keep going lower. Stock will continue its rally.

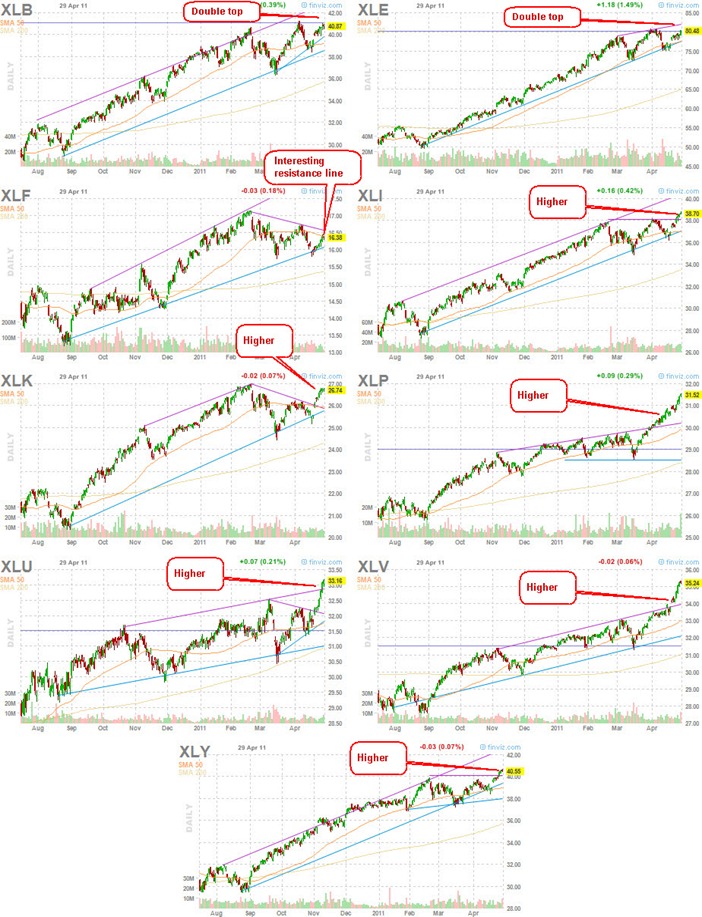
-- All sectors have taken out their resistance line, except XLF which is now at important junction.

clip_image002

-- US debt is not going away.

-- Japan problem is not resolve yet.

-- Spain debt problem is on the way.

-- Berkshire profit drop 58%. Market might take that as a slow down.

-- The bond king sold all his bond and some more short it.

-- S&P downgrade US debt.


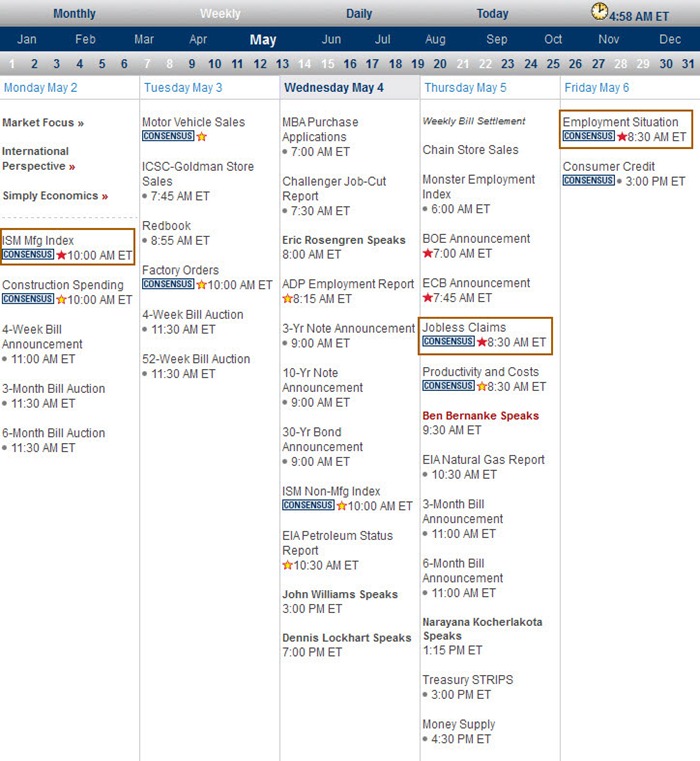
Next Week Economic Data:


clip_image003


Input:


  1. Not much data coming out next week. Should be an advantage for the BULL.


VXX chart:
 

clip_image004


Input:


  1. You just have to believe what you see. I know it does not make sense for the BULL to be this strong at all, but don't fight against it.


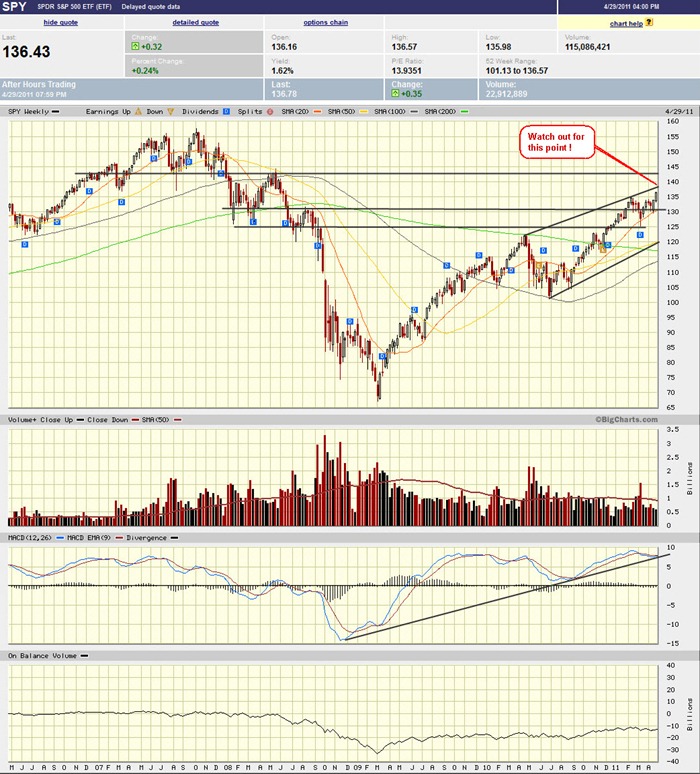
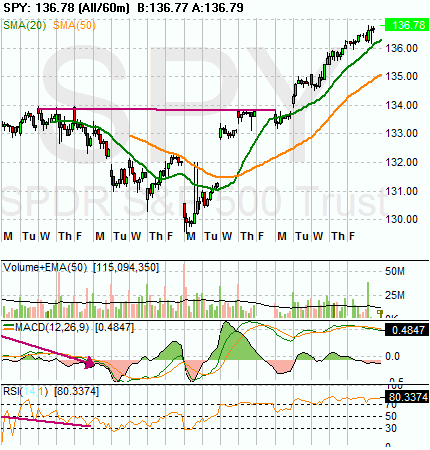
SPY chart:
 

clip_image005


clip_image006


clip_image007


Input:


  1. SPY clearly tells us that the BULL has leg. It still has some room to go before coming to the next resistance line. Watch out for at least a small correction when it reach there.


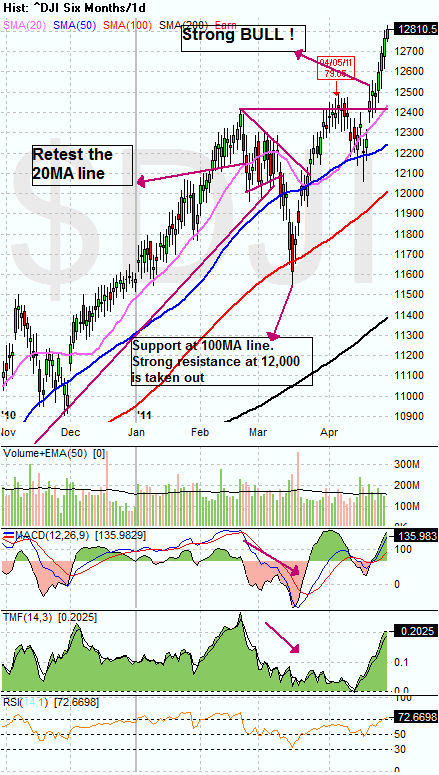
DJIA chart:
 

clip_image008


clip_image009


Input:


  1. Still has some room to go before coming to the resistance line of 13,000. Watch out for correction there.


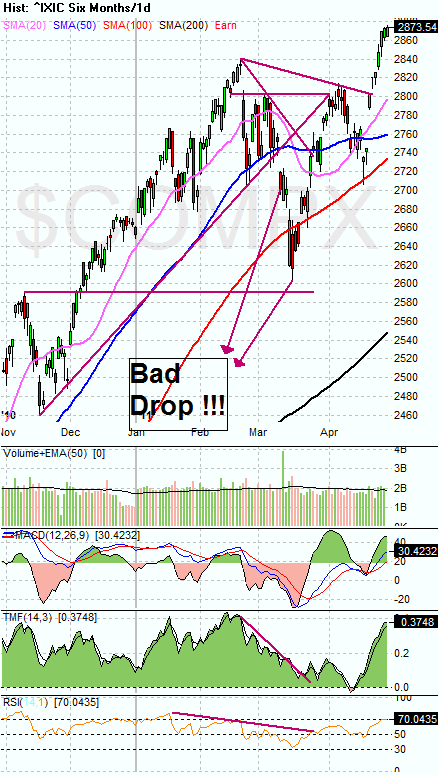
NASDAQ chart:
 

clip_image010


clip_image011


Input:


  1. NASDAQ just taken out the resistance line. It is all time high now. Seems like nothing is blocking it anymore. What a BULL !


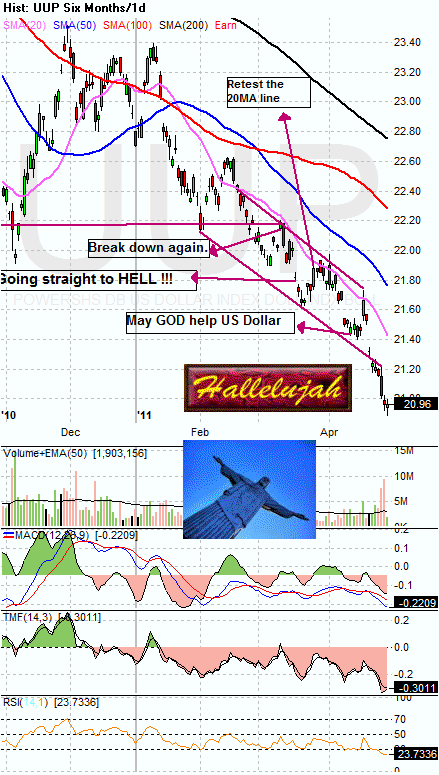
UUP chart:
 

clip_image012


Input:


  1. Do I have to say anything on this? USD buying power is gone for good.
  2. This is why GLD keep going up.


Sector Analysis:
 

clip_image013


Input:


  1. Other than XLF, all other sectors are going higher as indexes.
  2. Watch closely where the XLF will be going, it is now at a very important junction.


GLD, SLV, Petrol and Natural Gas charts:
 

clip_image014


clip_image015


clip_image016


clip_image017


clip_image018


clip_image019


Input:


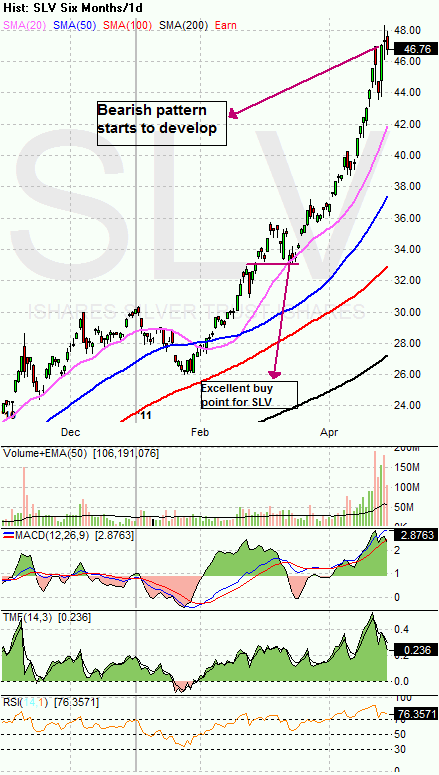
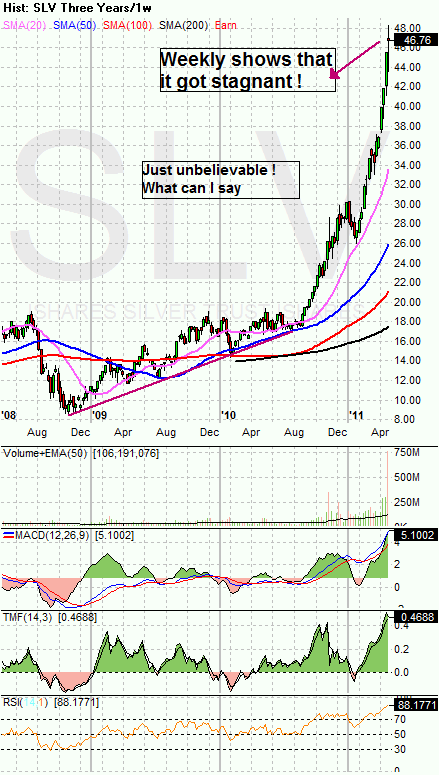
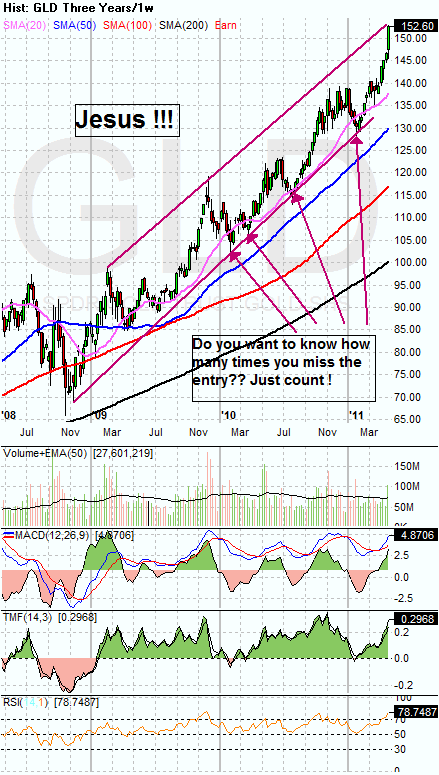
  1. It might be time to SHORT SLV by going long in ZSL.
  2. Don't short GLD first. It is still strong as long as UUP is weak.
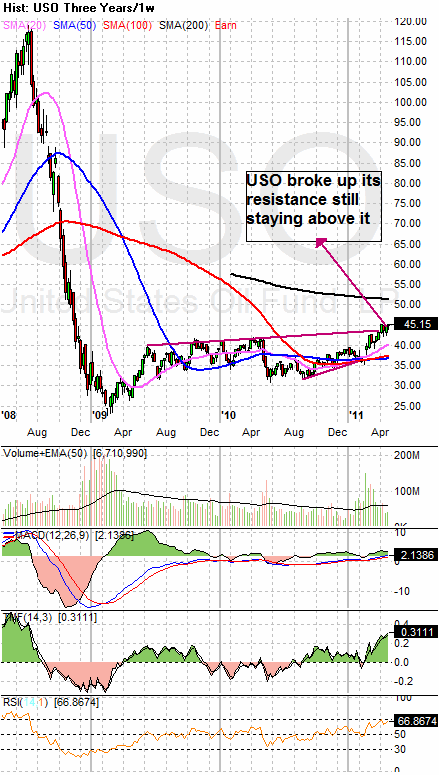
  3. USO up trend is still intact. Expect it to go higher even though now bounce into double top formation.
  4. Yes, I was right that UNG is a BUY.


FXI (iShares FTSE / Xinhua China 25 Index Fund) chart:
 

clip_image020


clip_image021


Input:


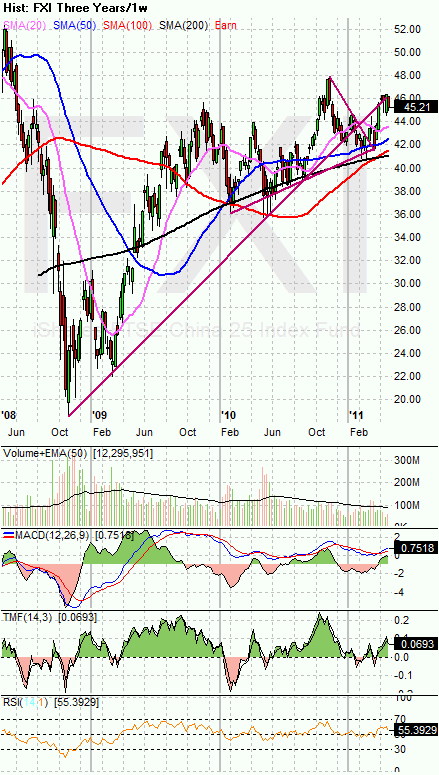
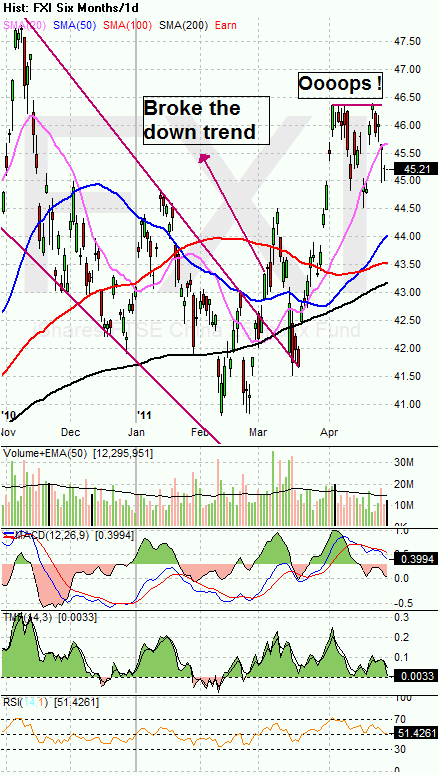
  1. Looks like FXI is facing a resistance at 46.40
  2. Looks very much like a head-n-shoulder, but no confirmation yet. Strong support at 42.00


Baltic Dry Index chart:
 

clip_image022


clip_image023


Input:


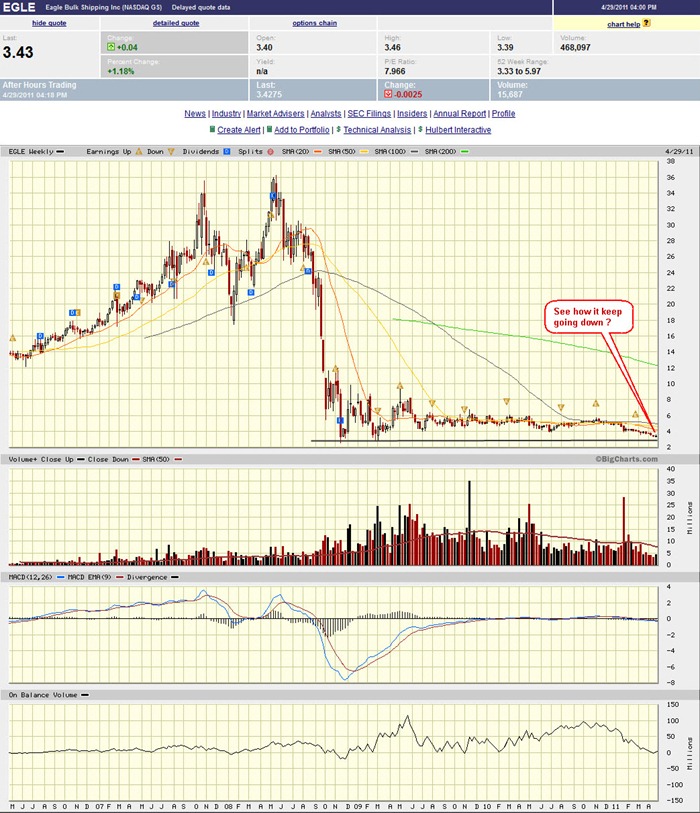
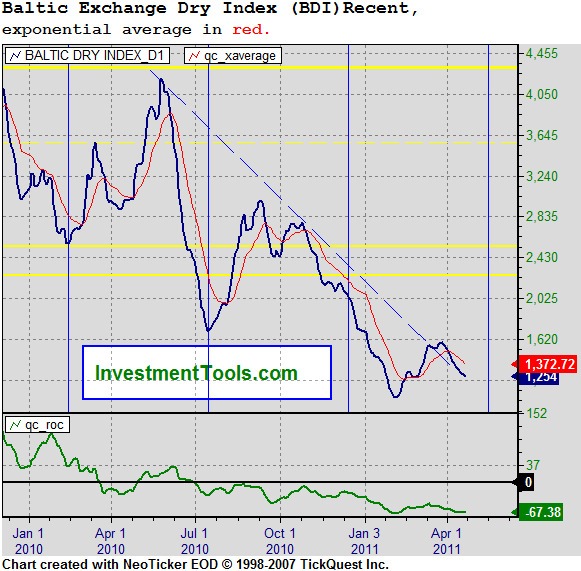
  1. See how important it is to monitor the Baltic Dry Index in order to have the right decision on stock investment in shipping companies? Check out how a sample shipping stock like EGLE going down step by step even though indexes kept going higher and higher.