Now… this really SHOCK me in a big way. Unbelievable rally.
Monday, September 20, 2010
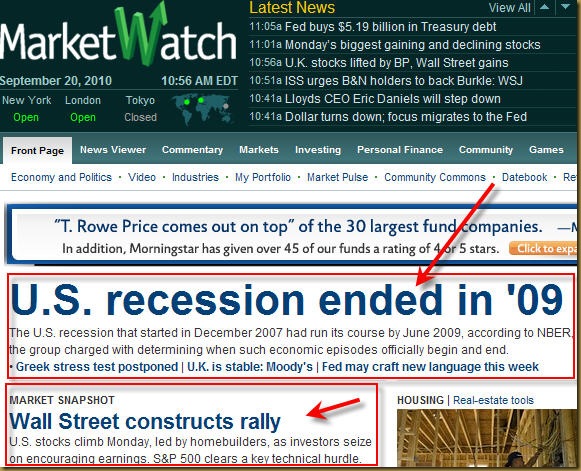


Sunday, September 19, 2010
19th Sept 2010 – My Analysis

Something that I need to clarify here:
- Short term means for 1 week
- Long term means for 6 months
- It is going to be another heavy data week ahead especially on Tuesday night the FOMC interest rate announcement.
- My analysis can be tilted 180 degree by BEN on Tuesday night.
| Short term (1 week) | Long term (6 months) |
| | |


Why do I say so:
- http://www.elliottwave.com/freeupdates/archives/2010/09/15/The--Outright-Deflation--Economy-Enters-A--Critical-New-Phase-.aspx.
- http://slopeofhope.com/2010/09/they-can-almost-taste-it.html.
- This expert is saying that we have a long term BULL market. Better be careful. But he still feel that his claim will only be more true if SP500 broke the barrier of 1130. http://blogs.decisionpoint.com/chart_spotlight/2010/09/new-long-term-buy-signal.html.

VXX chart:
Input:
- Long term Renko chart tells me that there might be still downside for VXX. So all my Short positions are not secured yet.
- Long term OBV and MACD still look Bearish. So be agile when needed.
- Short term VXX chart looks like going to do Bullish cross with a high volume coming in. Again, still not crossed yet.


SPY chart:
Input:
- Short term 20MA and 50MA lines are about the do the Bearish Crossing.
- Short term SPY value is falling below the 50MA line for the first time in the past 2 weeks or so.
- Short term high volume sell Friday night early in the night.
- Short term MACD is dipping into the -ve zone.
- Long term chart is still facing resistance at the 113 line.
- It is a bit hard to read, but look at the 3Yr 1Wk long term chart, 20MA fall below 50MA line again. Is this a loud and clear SELLLLLL signal?

![clip_image001[5]](https://blogger.googleusercontent.com/img/b/R29vZ2xl/AVvXsEiwuQJ5qsuxEssqKvH-szNPb4w0nLxcBH5FC-C8fAgdtLSj0tMtGTsluCOxdfzkBGEIyGECy9PfnDnAVW-2RpkFwvJxkYLiOhKA8hA83qECB7HF9rvOgnYxOhdxqa5mfkmQuYA0bF9ueYY/s1600-h/clip_image001%5B5%5D%5B3%5D.gif "clip_image001[5]")
![clip_image002[5]](https://blogger.googleusercontent.com/img/b/R29vZ2xl/AVvXsEhX8L2MWxIo8QeLR0ls-sWOzVBH8SZJj-7R0MQRWspso3RI3J5MHxgbaJsEGtLrjyL8pkAV7C832P39Bs5dqHuPTE8t0zLP63rOsI9DKjf8vKclLR5T-n1yFGTrftifuS3aHcJLGOhrq0I/s1600-h/clip_image002%5B5%5D%5B3%5D.gif "clip_image002[5]")

DJIA chart:
Input:
- Not as Bearish as SPY, maybe not yet
![clip_image001[7]](https://blogger.googleusercontent.com/img/b/R29vZ2xl/AVvXsEiuWoUBu-cg1lgA7PC0p4lutpjtVDrYrqPMX_z9v9tX22B0figxNhlfccTlR9oF3TE3vkwVJd1-zRRDqVef4hYW282tRtAezaxztUSoK1wmFbCS0ooDVzAL6y25Wb1ZBZX2OB_SvfUheqM/s1600-h/clip_image001%5B7%5D%5B3%5D.gif "clip_image001[7]")
![clip_image002[7]](https://blogger.googleusercontent.com/img/b/R29vZ2xl/AVvXsEh9Hbj3y3PCskLhPPXeC8leJsjsQ0Ufgt8Hm-GBiQSL7N8Y6RyQs9l-n_ggpF0O5goD-dlQHPXMTQ0cu7UqUyurjVBpHfQ5o7poIoVgm1pJWd6I9_5t706pAODmEk6MyoNW3Whyphenhyphen9_4v1P4/s1600-h/clip_image002%5B7%5D%5B3%5D.gif "clip_image002[7]")
Saturday, September 18, 2010
18th Sept 2010 – A study on Volume.
I hope the volume shown on the following charts are telling the Truth and nothing but the truth.


I don’t know what else to say if I am still on the wrong side of the trade.

Friday, September 17, 2010
17th Sept 2010 – Another shot on the Dragon.

Input:
- Pretty much same for me to Short JPM.
| Buy $ | Sell $ | Sell Short $ | Buy Back $ | Stop Loss $ | Profit / Losses |
| 13.15 |
|
|
| 12.65 |
|
Reason for Buy / Sell / Sell Short / Buy Back:
- Pretty much same reason for me to Short JPM.
- FAZ has been staying at the range of $13.00 for 4 days already.
- MACD bullish up.
- Long term chart shows double bottom and looks like a bottom isolation island.
Lesson Learnt:
- Pretty much same reason for me to Short JPM.
Intraday Chart

Historical Chart

17th Sept 2010 – My daring SHORT on JPM.
Now… don’t do this at home without your parents guidance. It can be lethal.

Input:
- This is a tough call. I am actually trying to find and predict the TOP. Might not be a good thing to do at all.
| Buy $ | Sell $ | Sell Short $ | Buy Back $ | Stop Loss $ | Profit / Losses |
|
|
| 40.80 |
| 41.56 |
|
Reason for Buy / Sell / Sell Short / Buy Back:
- Short term chart shows weakness. MACD trending down.
- SMA(20) curving down.
- Short term up trend line also been punch through.
- Long term chart shows big resistance by 200MA and 50MA line.
- Long term chart candle stick looks like a isolation island to me.
- Short term SPY chart told me that I should be safe to go in now.
Lesson Learnt:
- I think it is safer to short at this position.
- I found that many stocks (even other than financial stocks) are making lower high and lower low.
- Even though few financial stocks are making high but they keep on been cap down by resistance. Can't really go much higher.
Intraday Chart


Historical Chart




17th Sept 2010 – CPI Report
Looks like market is set for another rally.
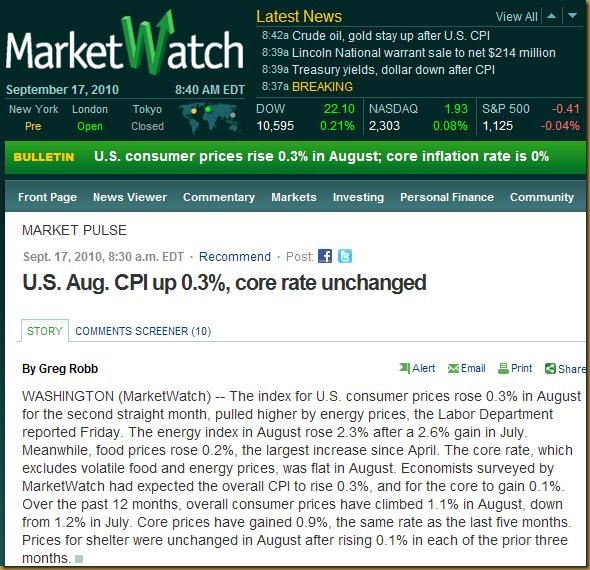
Half an hour later….

This is going to make the market zig-zag again.

Thursday, September 16, 2010
16th Sept 2010 – Another cutting on NanYang.
These are cutting on Lehman, GS and JP Morgan.


If you have bought in GS and JPM when it dipped, you will be ok now.
16th Sept 2010 – Cutting from NanYang Newspaper.
These are some cuttings from NanYang newspaper.
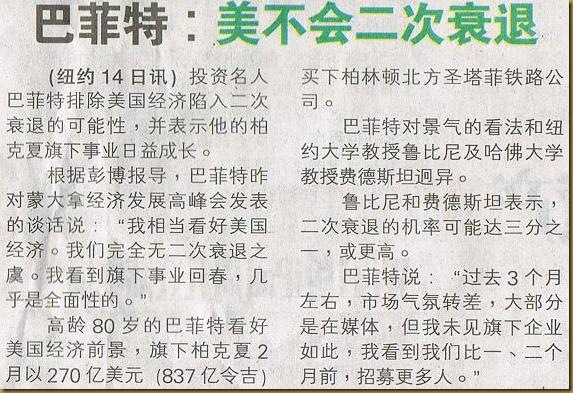

Now… is this the signal that Double Dip is imminent?

Subscribe to:
Posts (Atom)